At a glance
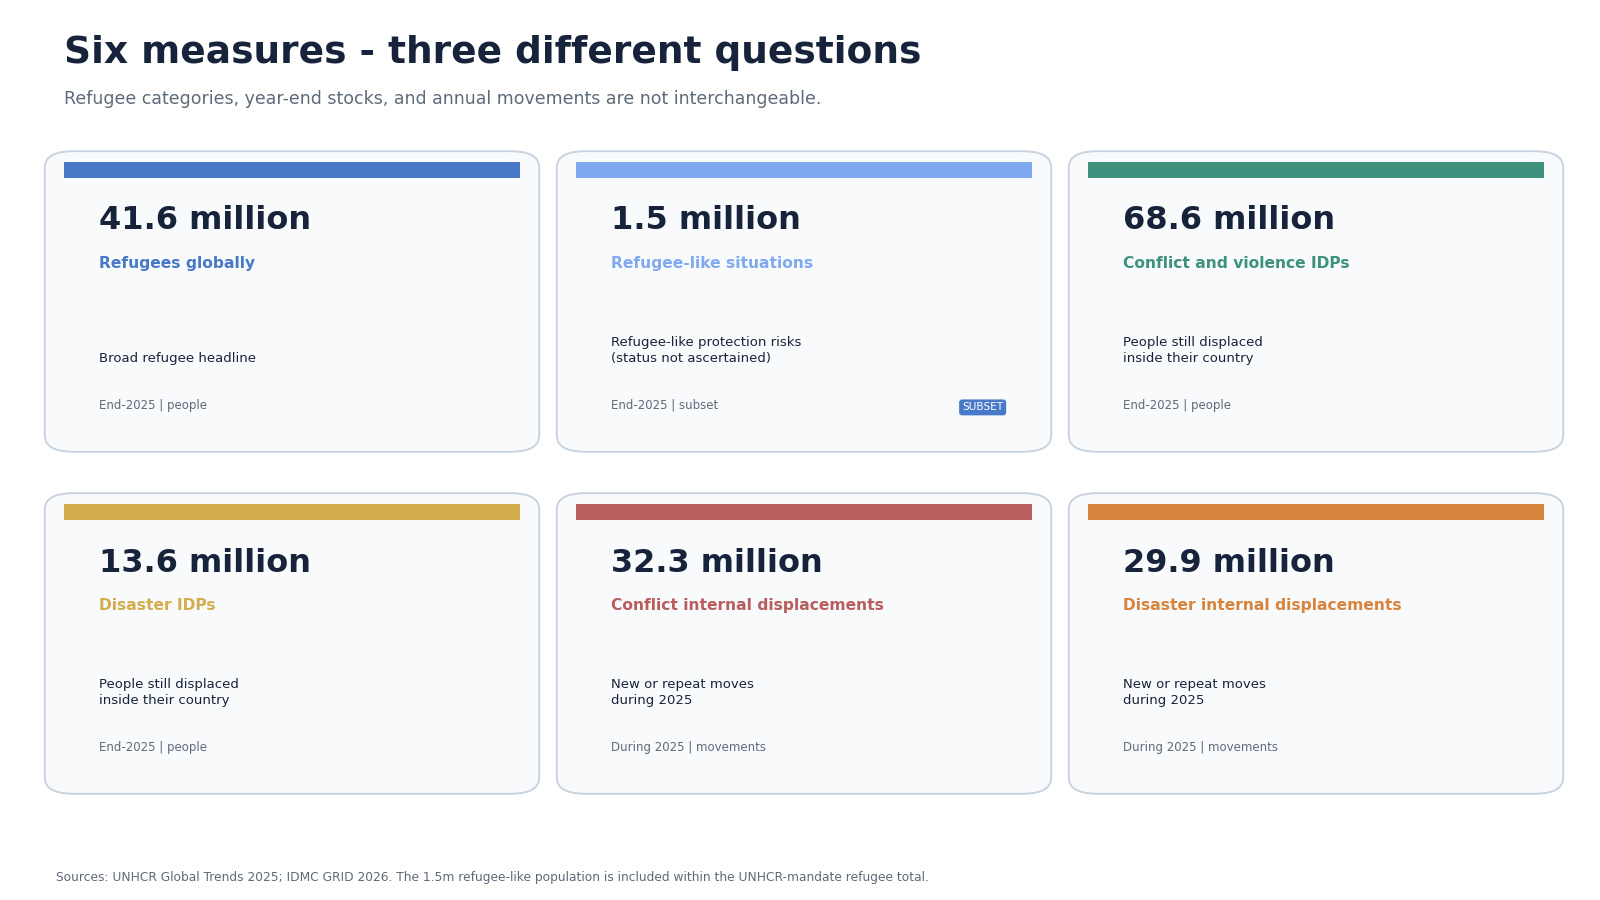
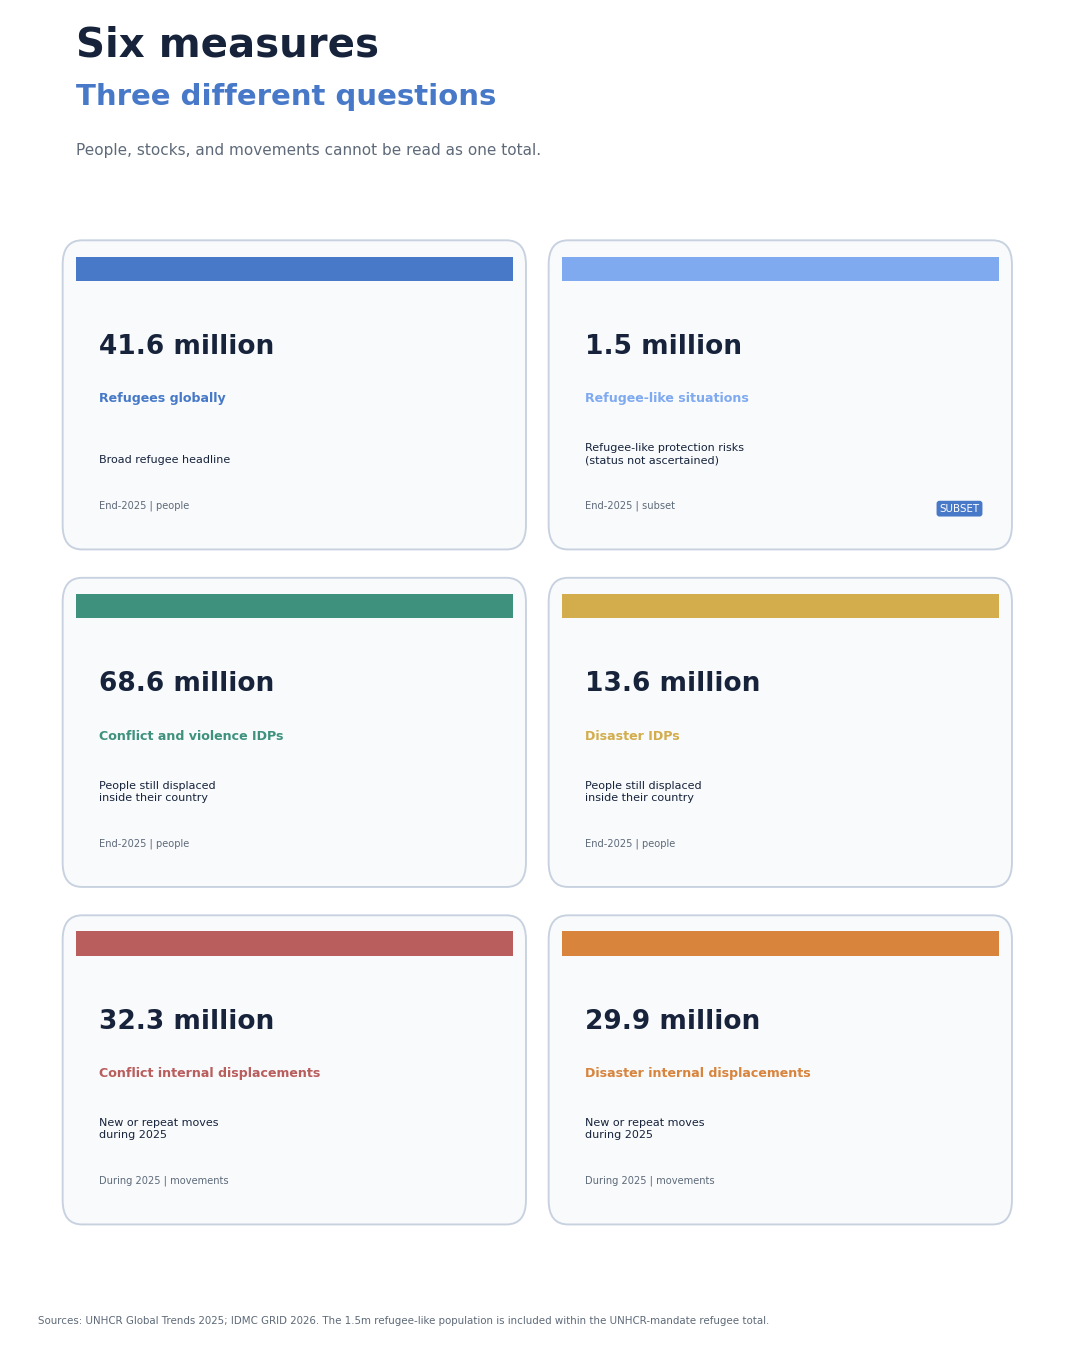
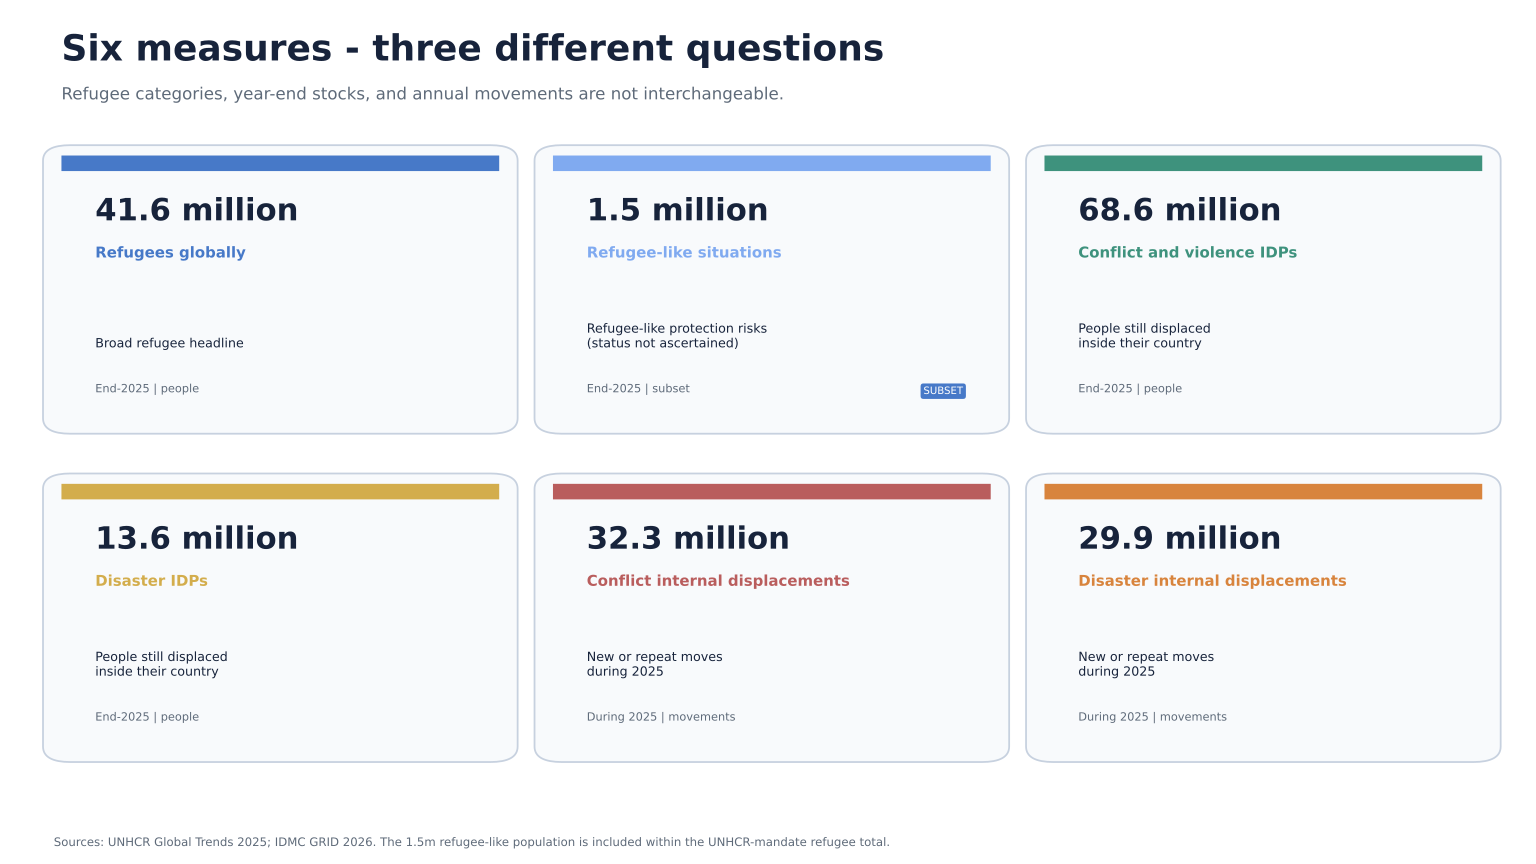
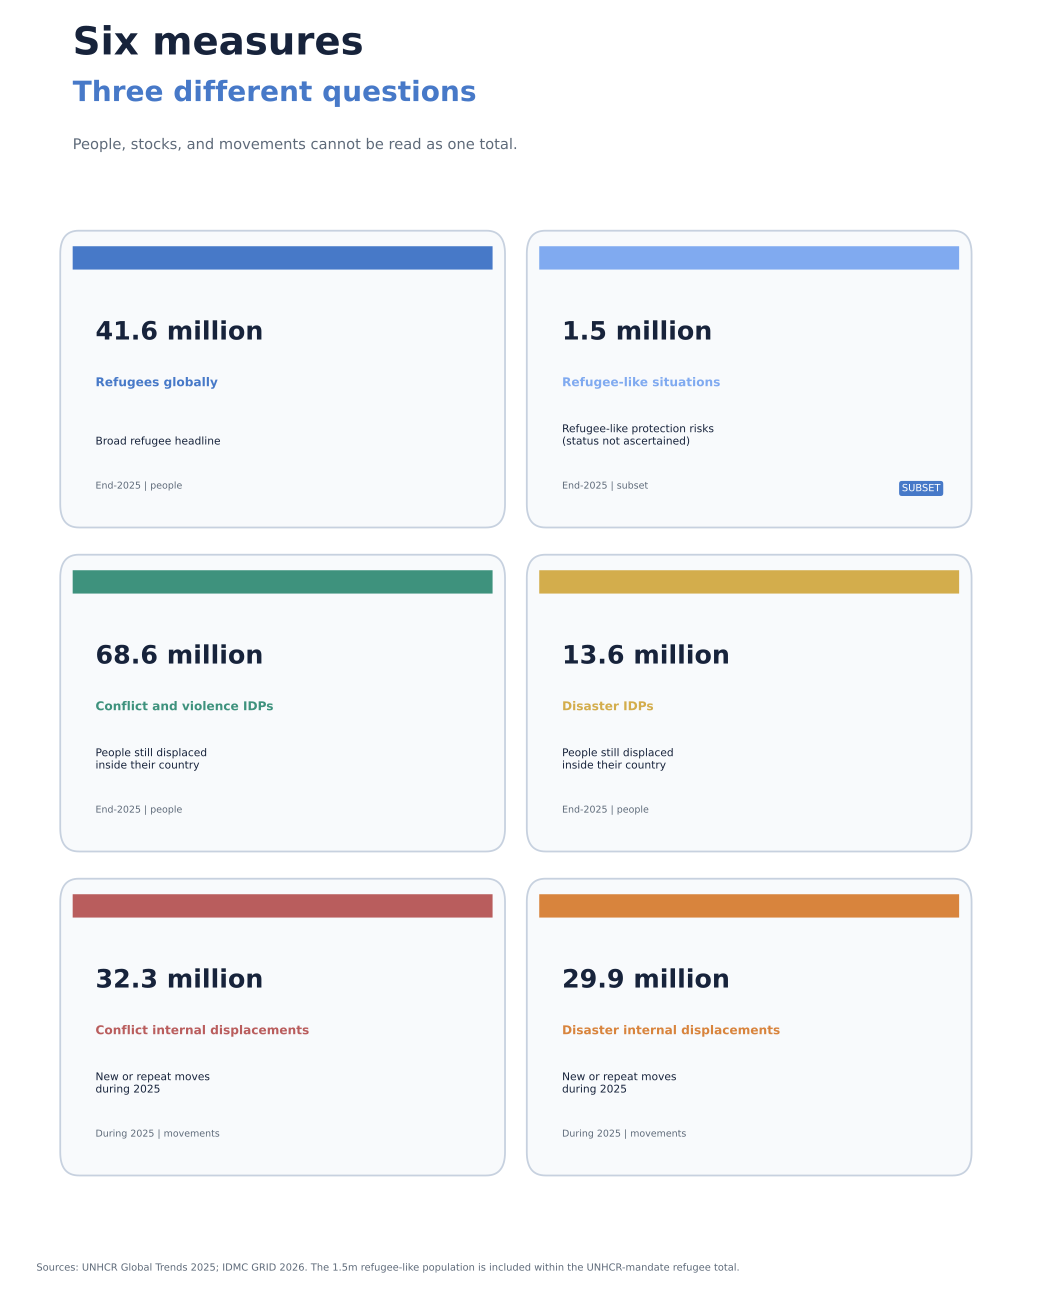
Six measures - three different questions
Displacement statistics can describe legal or protection categories, people remaining displaced at a point in time, or movement events during a year. The differences matter.

WSI Visual Brief
Refugees, internal displacement, and displacement movements answer different questions.
Refugees have crossed an international border. Internally displaced people remain within their country. Stocks count people still displaced; annual flows count movement events. These figures should not be added together.
At a glance
Displacement statistics can describe legal or protection categories, people remaining displaced at a point in time, or movement events during a year. The differences matter.
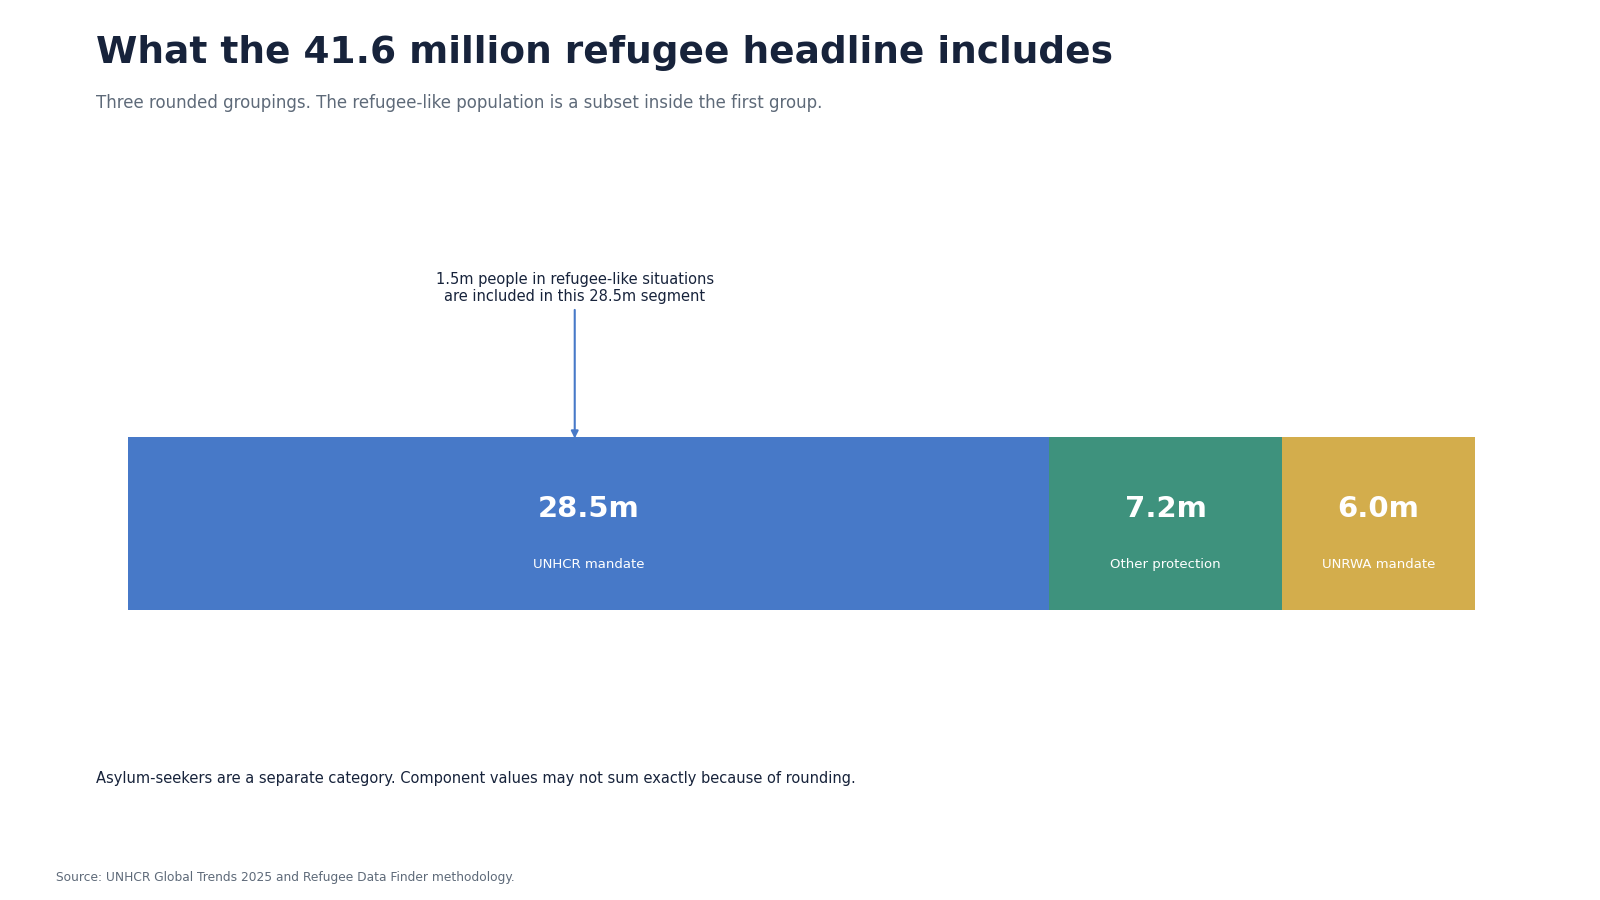
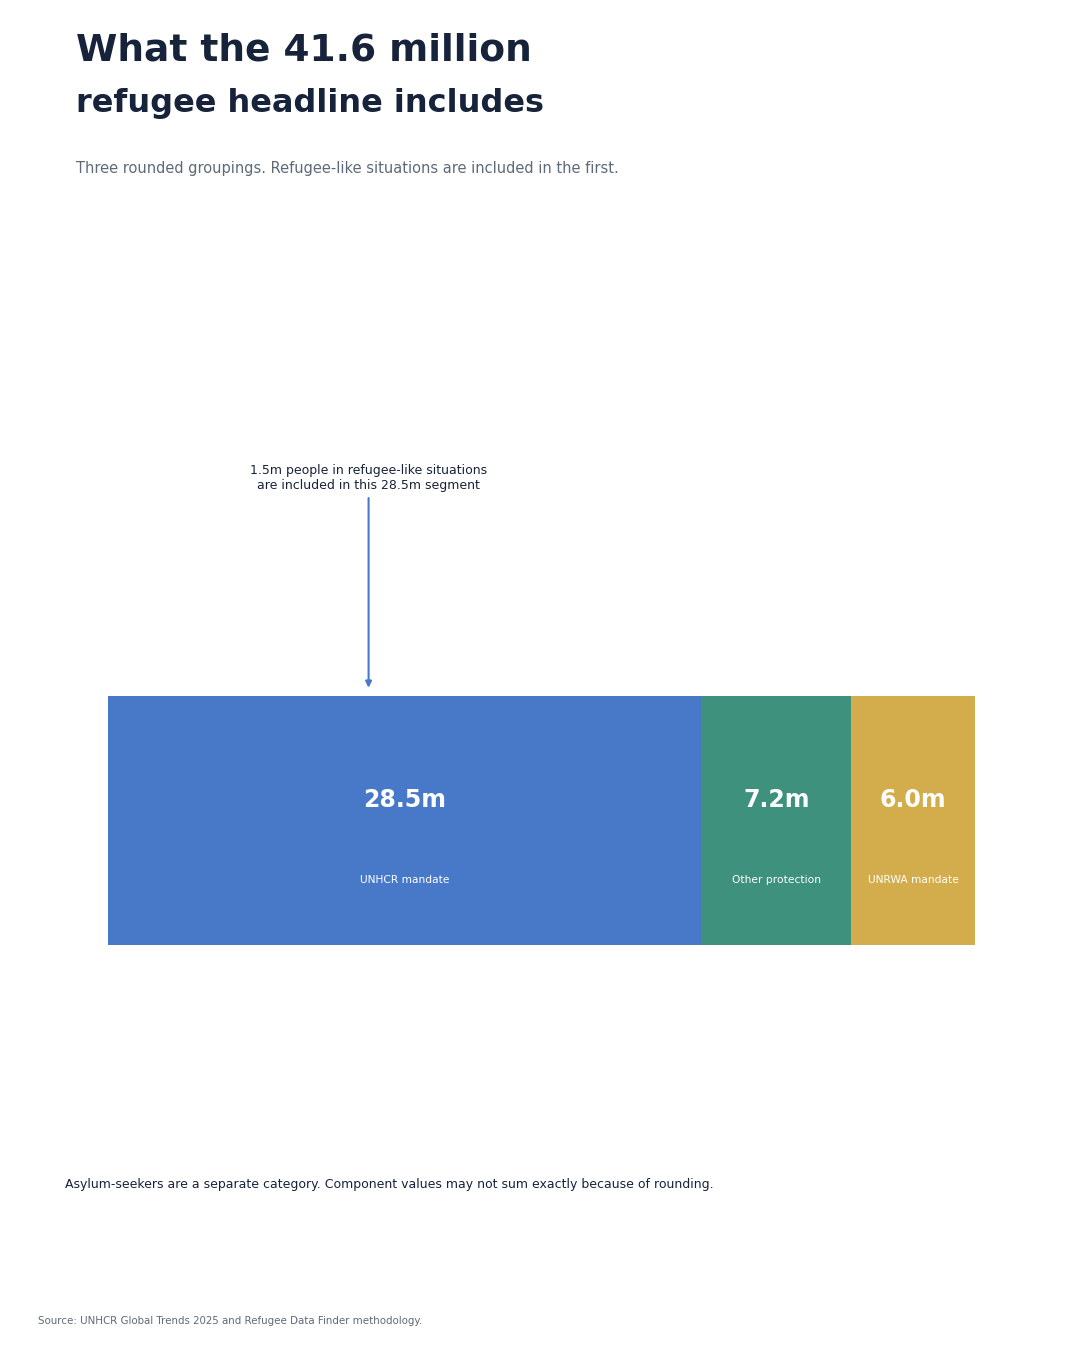
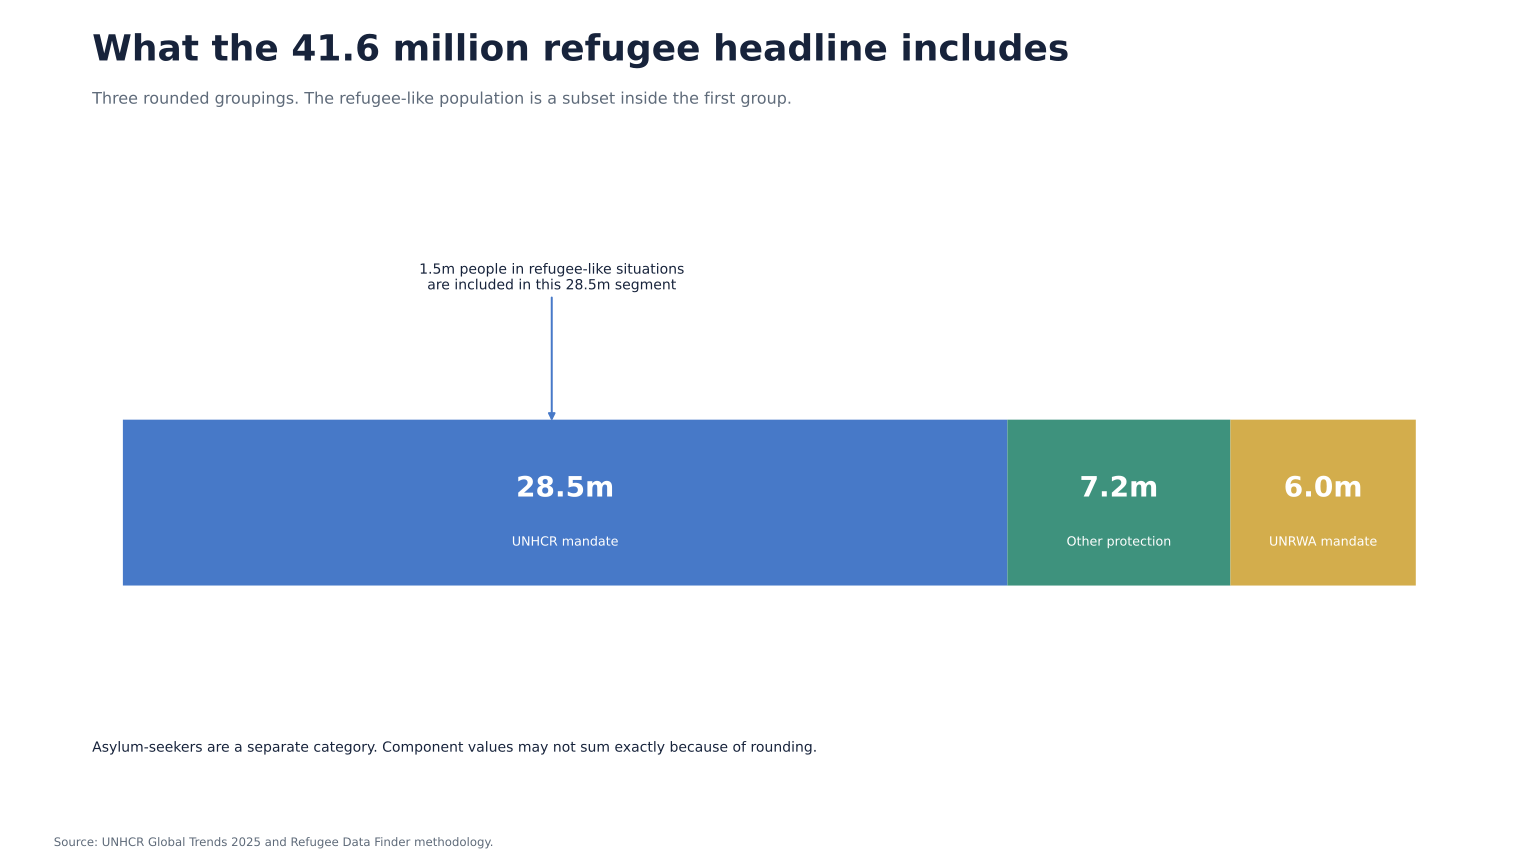
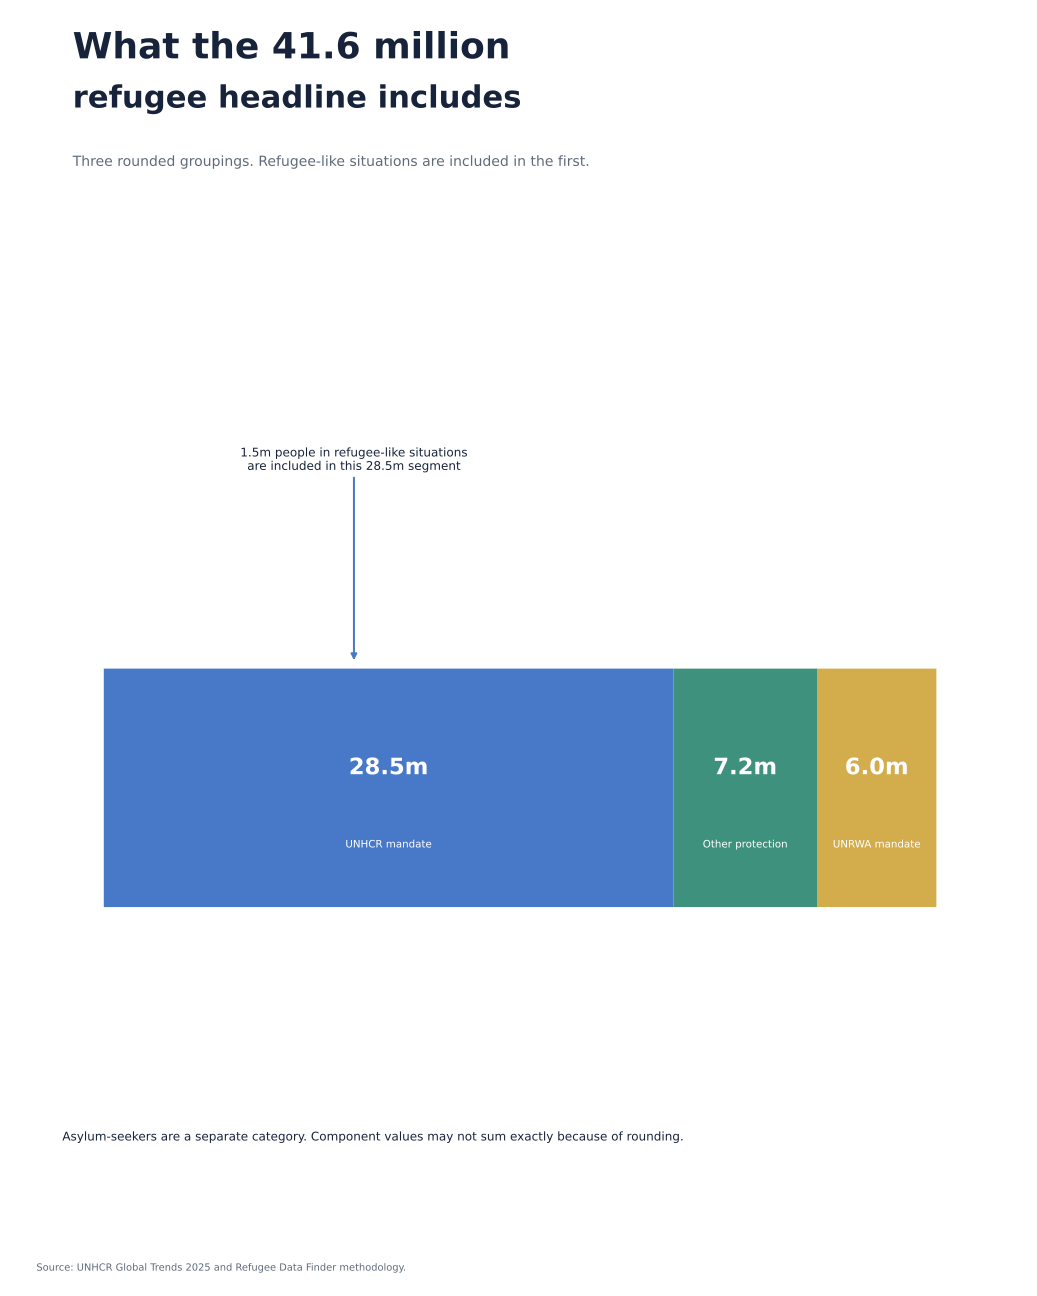
UNHCR reported 41.6 million refugees globally at the end of 2025. The broad headline includes refugees under UNHCR mandate, other people in need of international protection, and Palestine refugees under UNRWA mandate. People in refugee-like situations sit within the UNHCR-mandate refugee population.

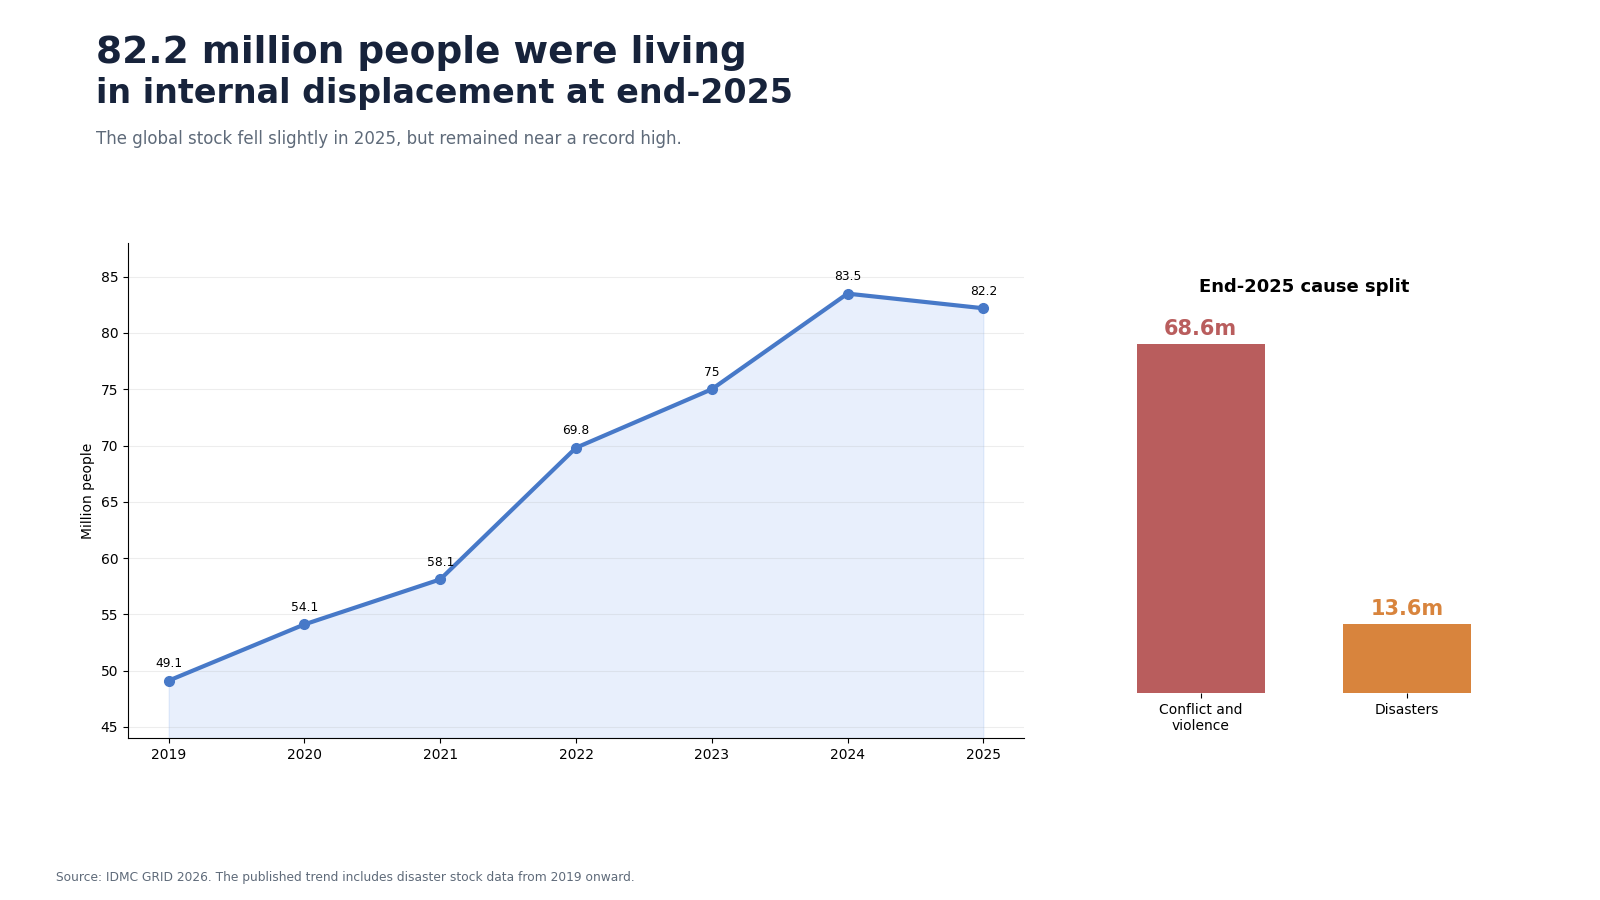
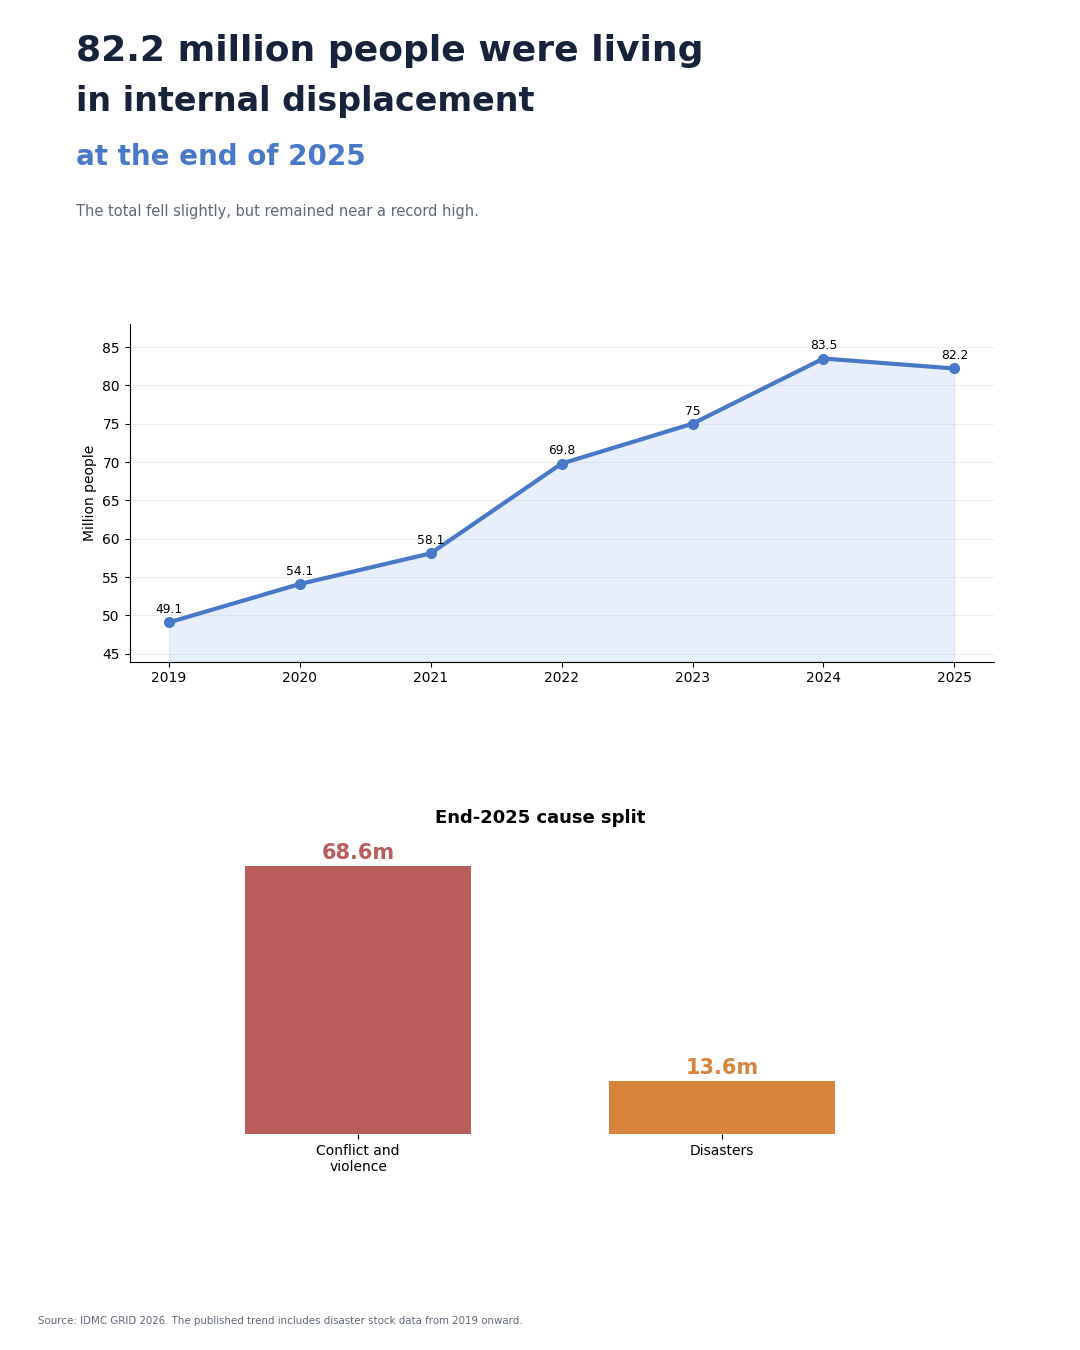
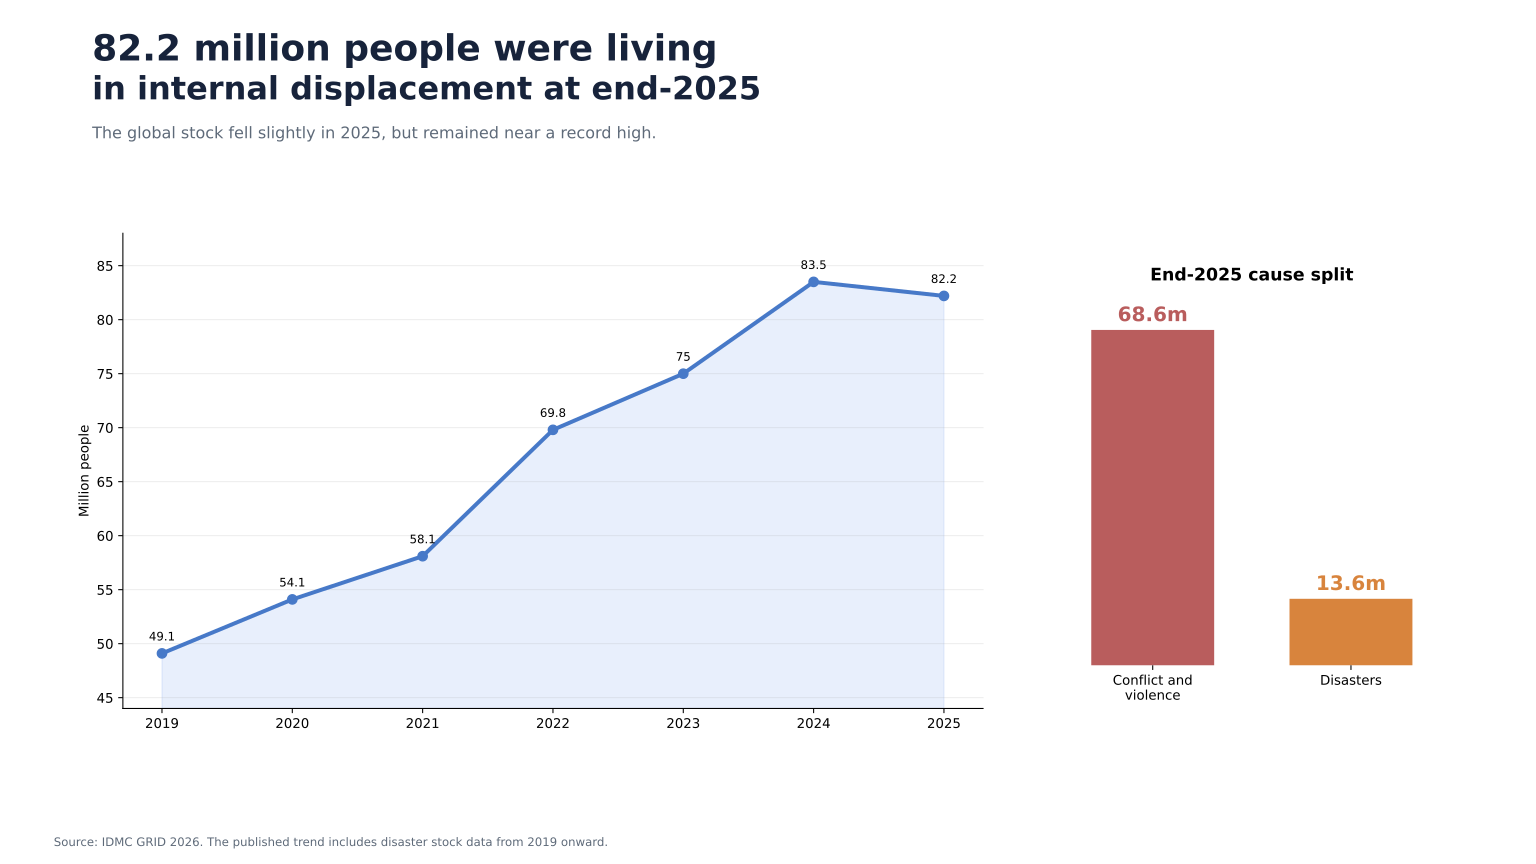
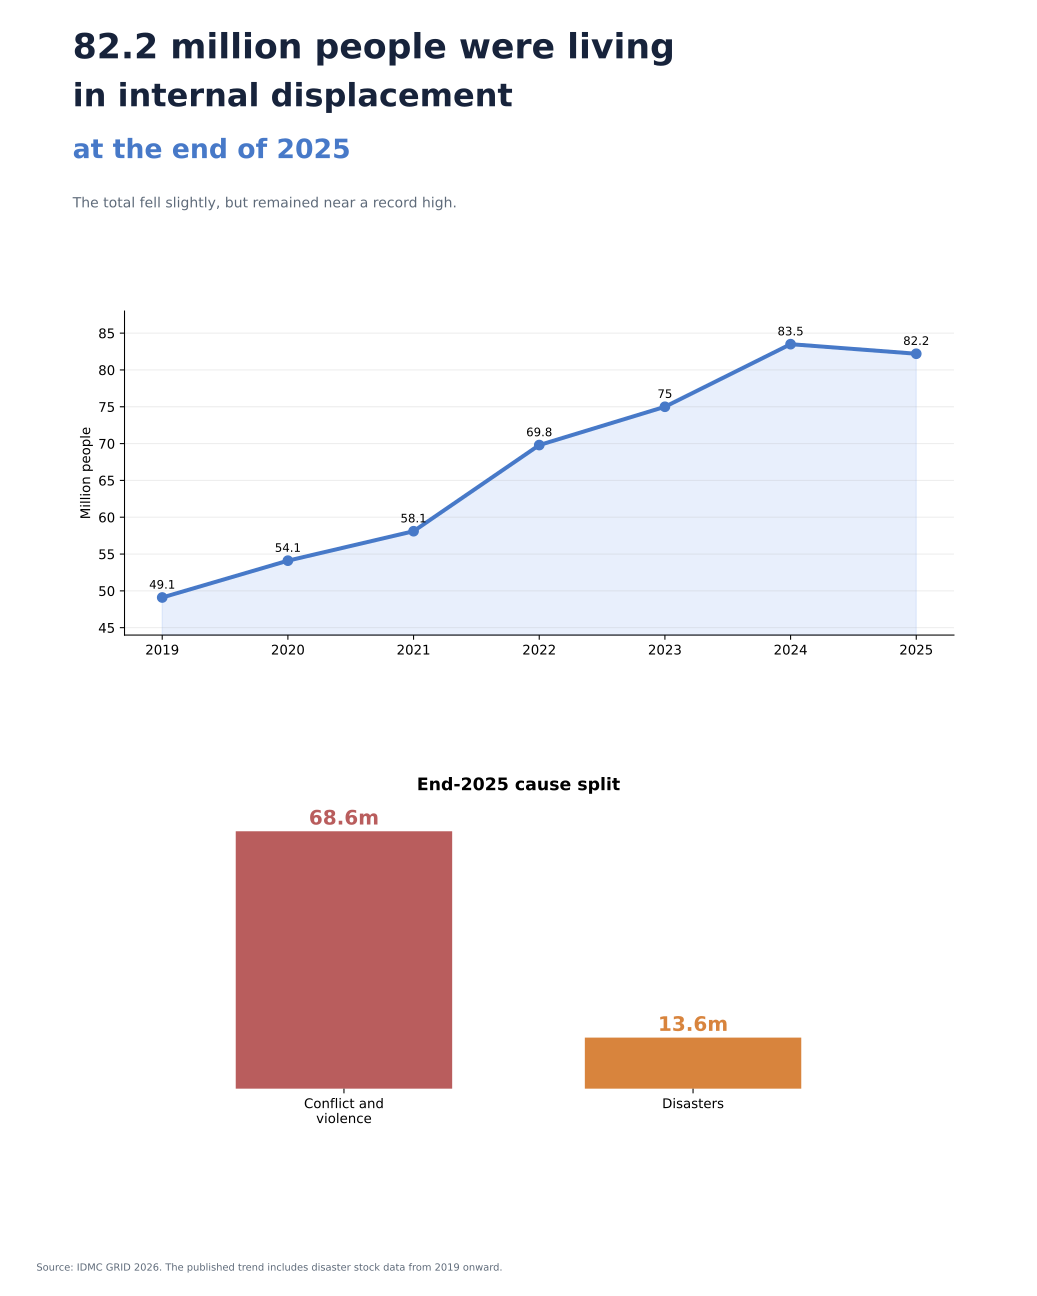
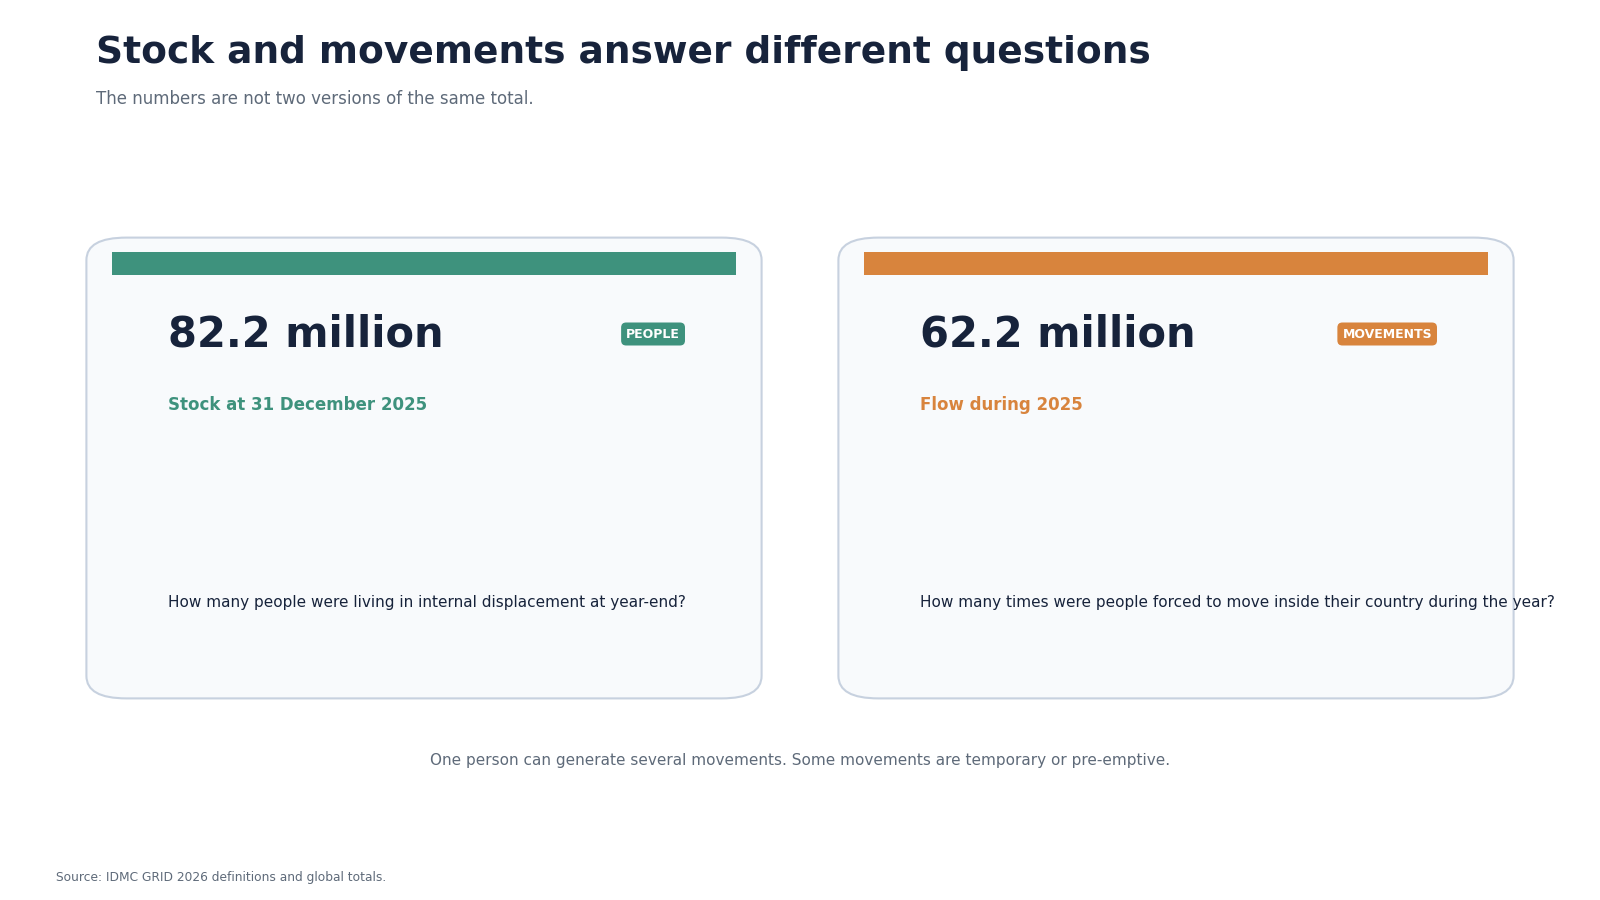
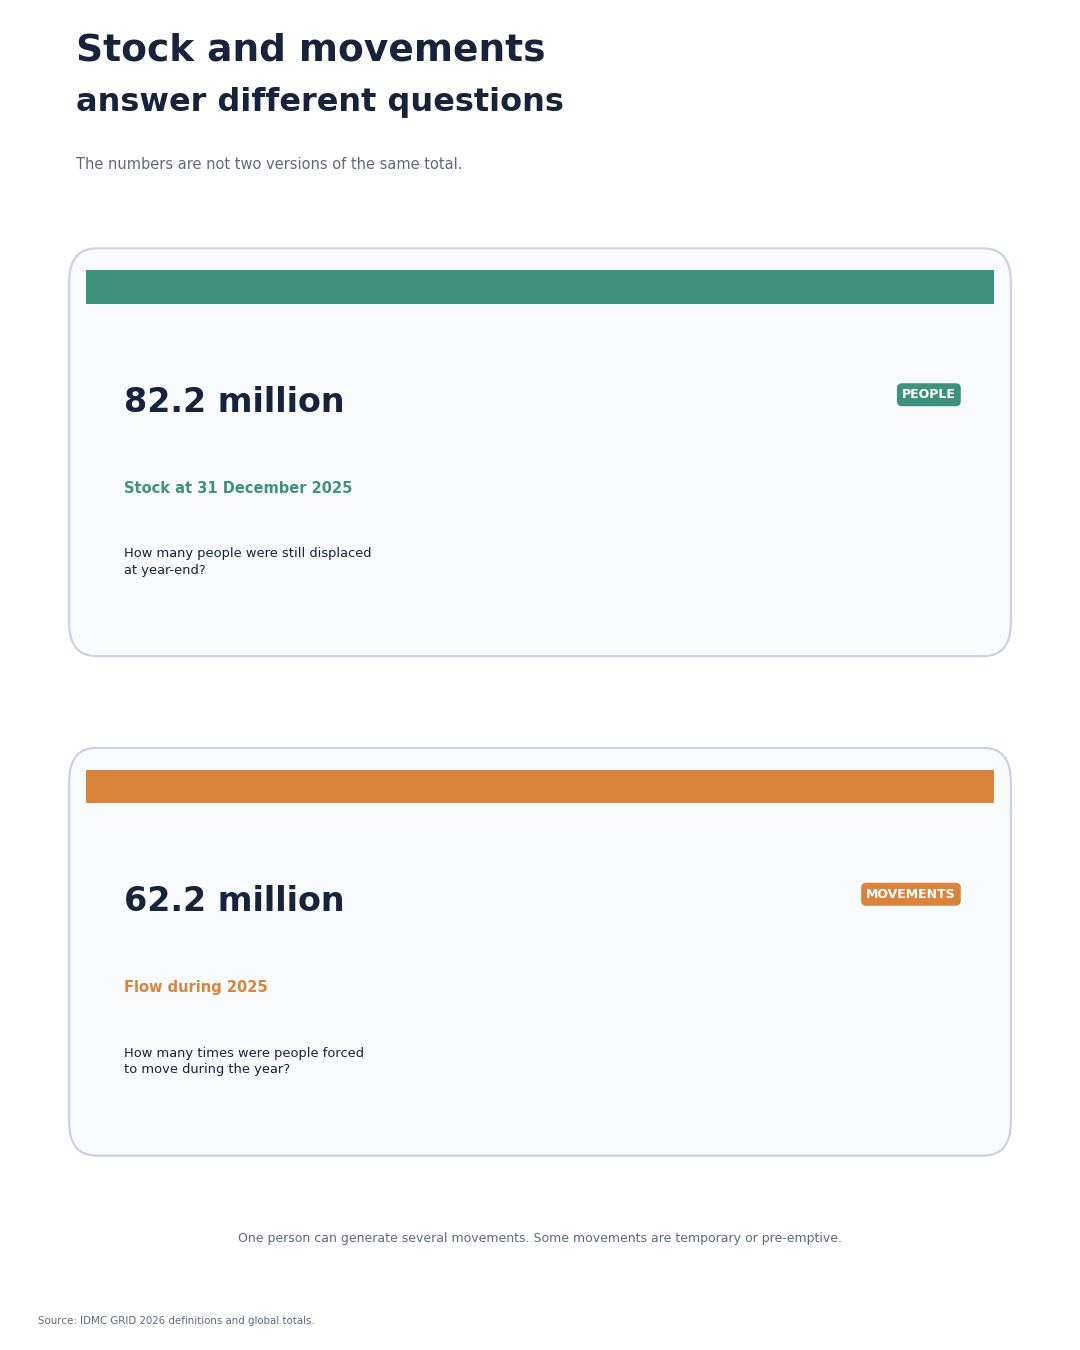
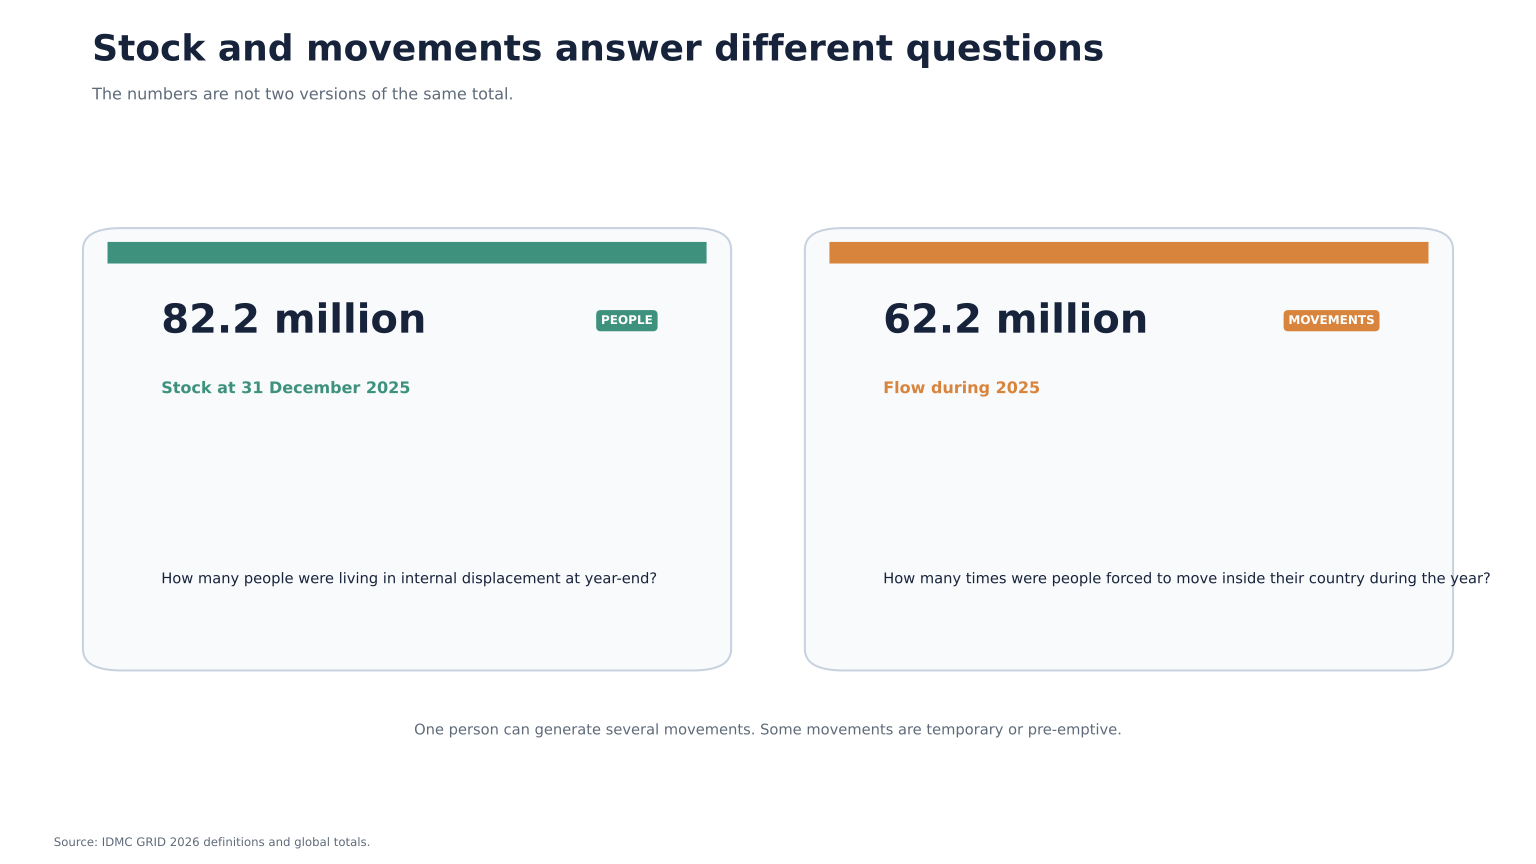
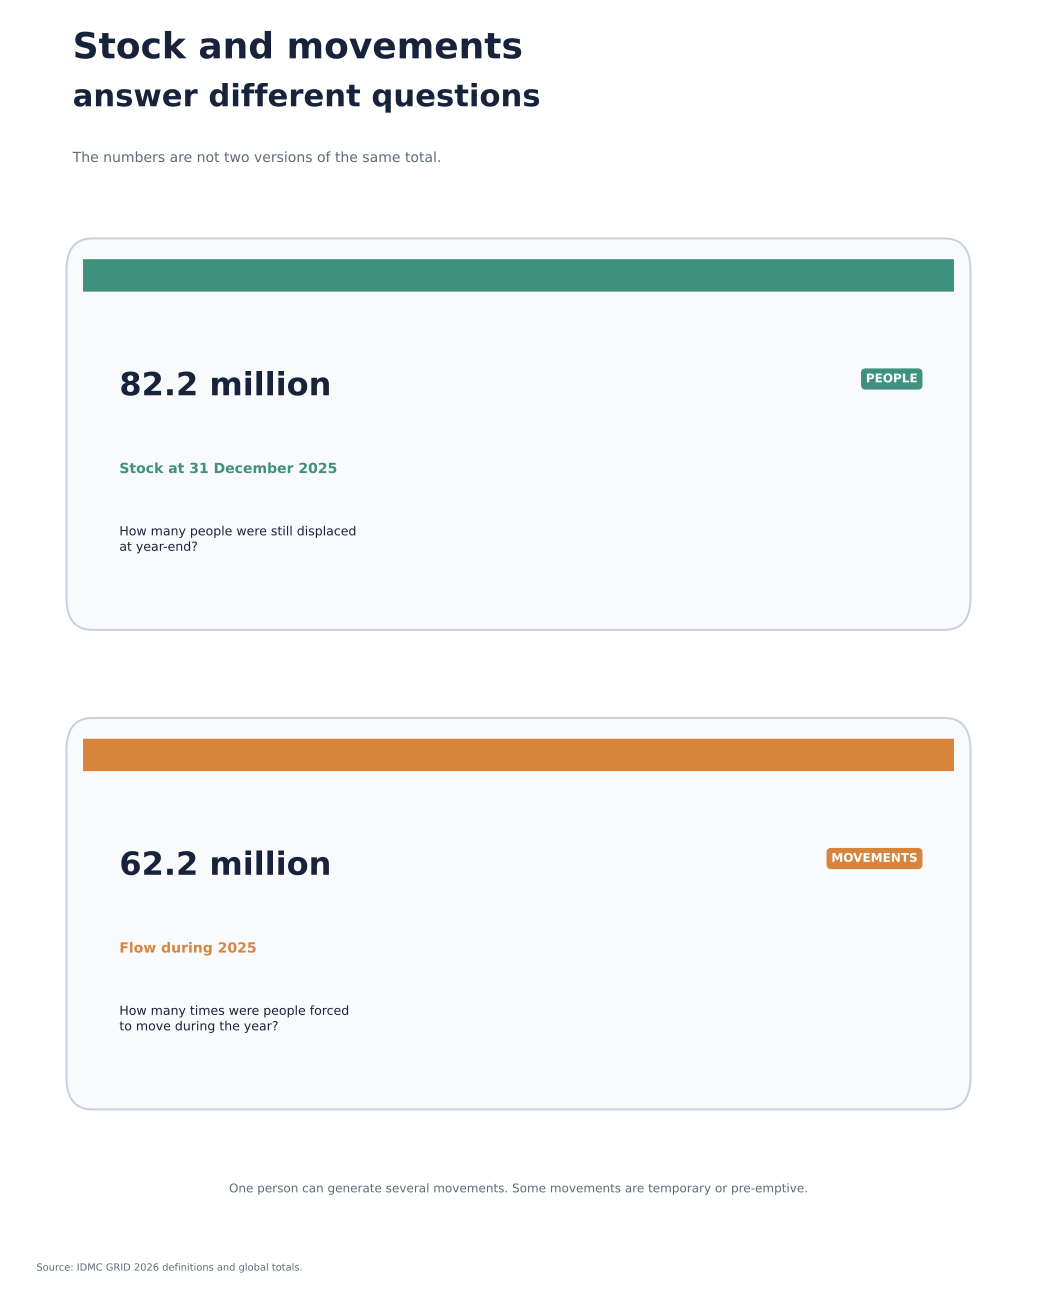
IDMC estimated that 82.2 million people were living in internal displacement across 104 countries and territories at the end of 2025. The total fell slightly from 2024 but remained close to the record level.

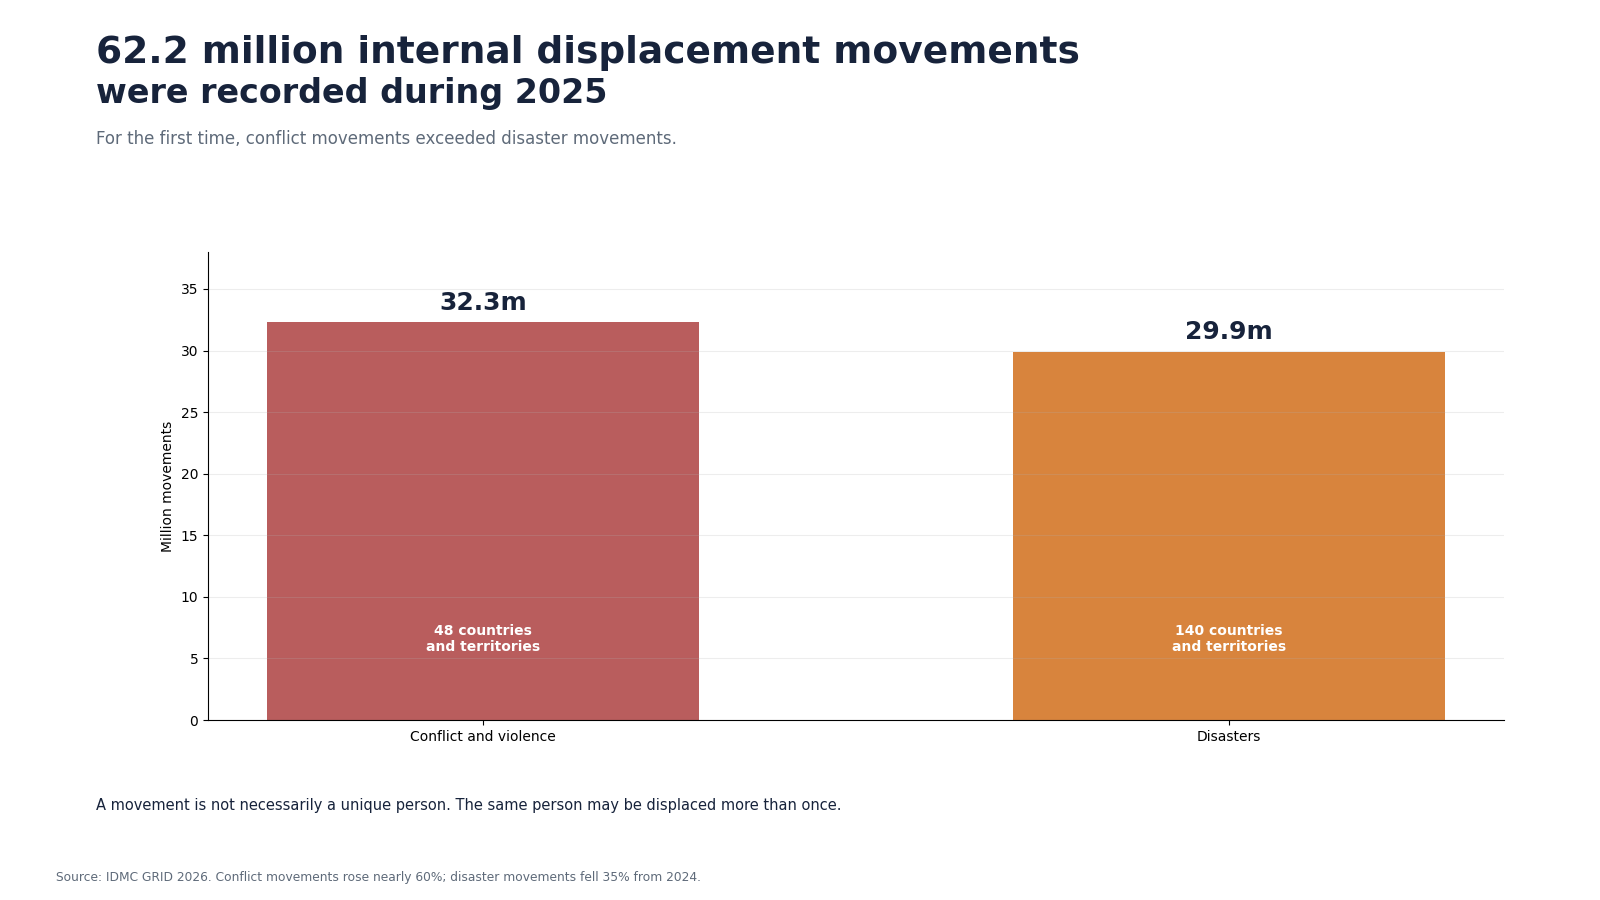
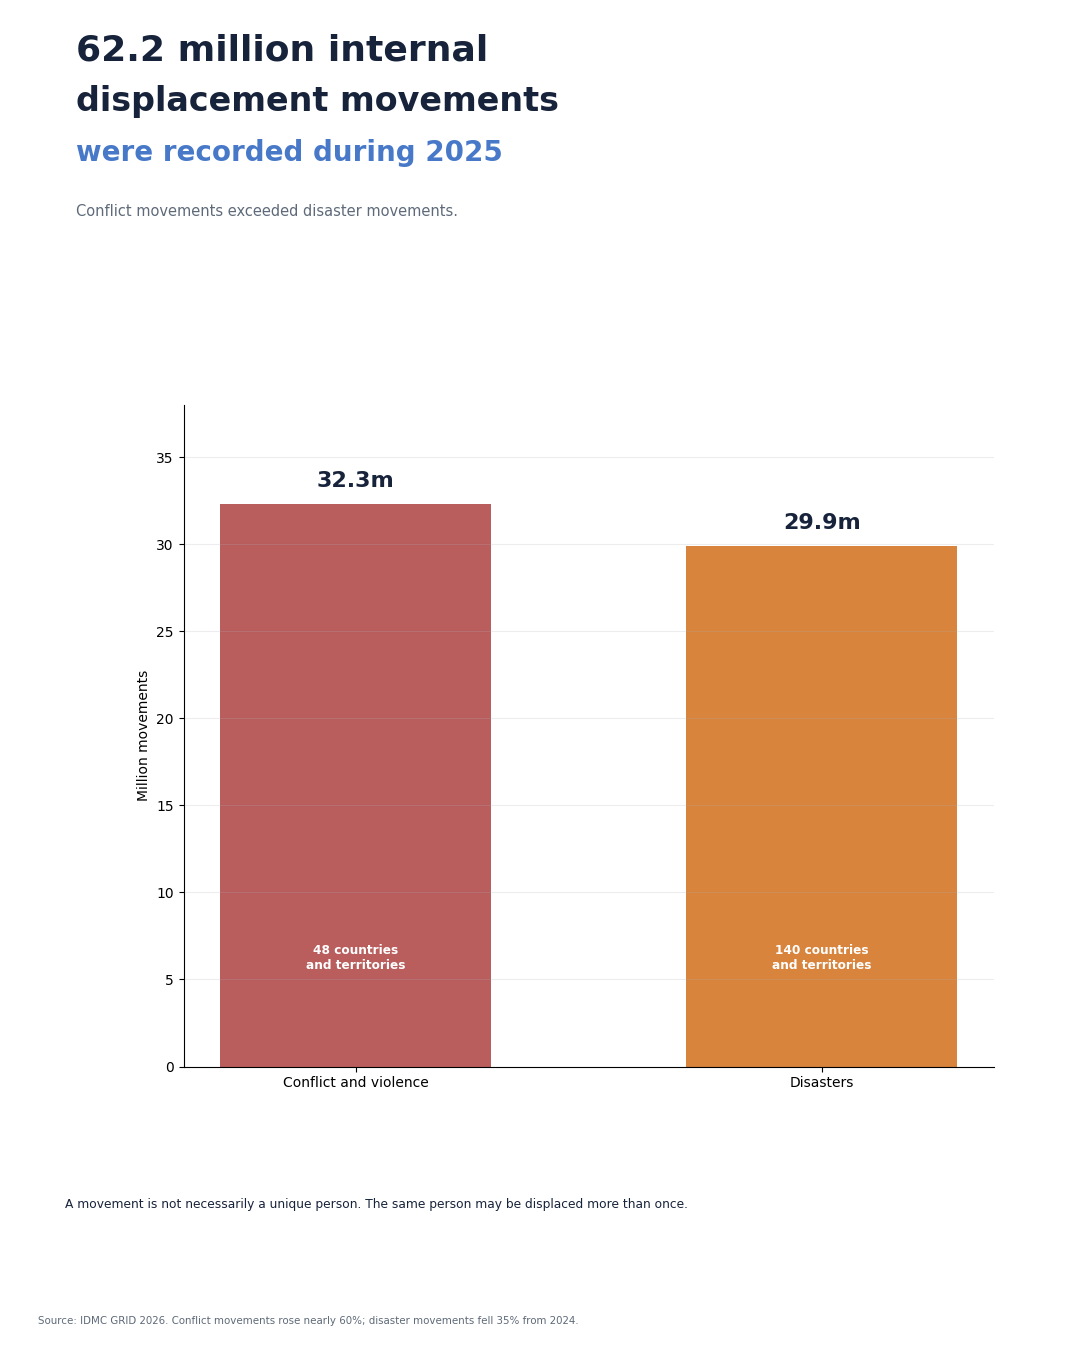
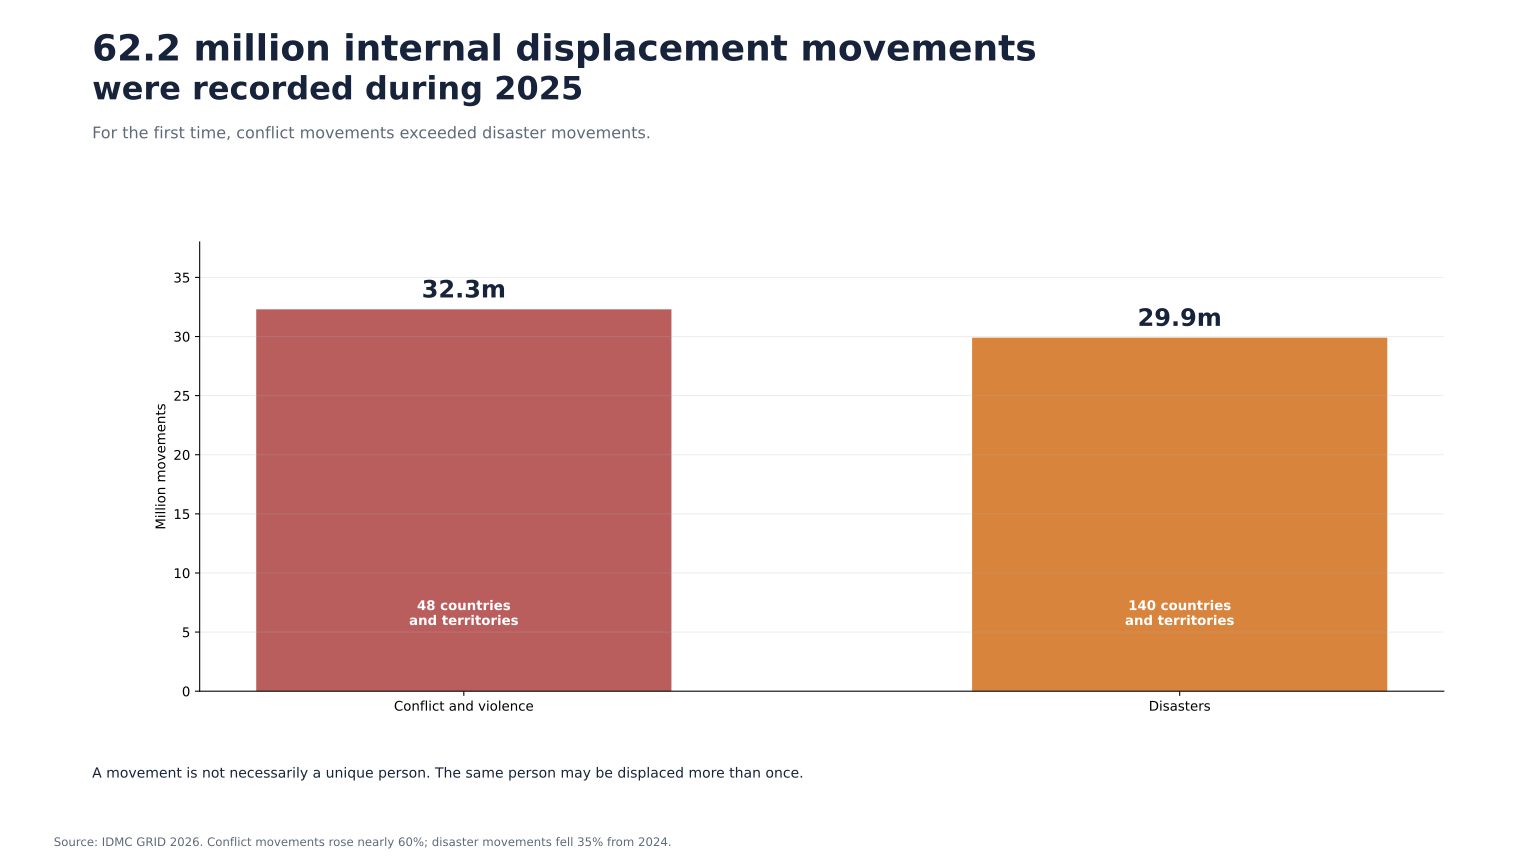
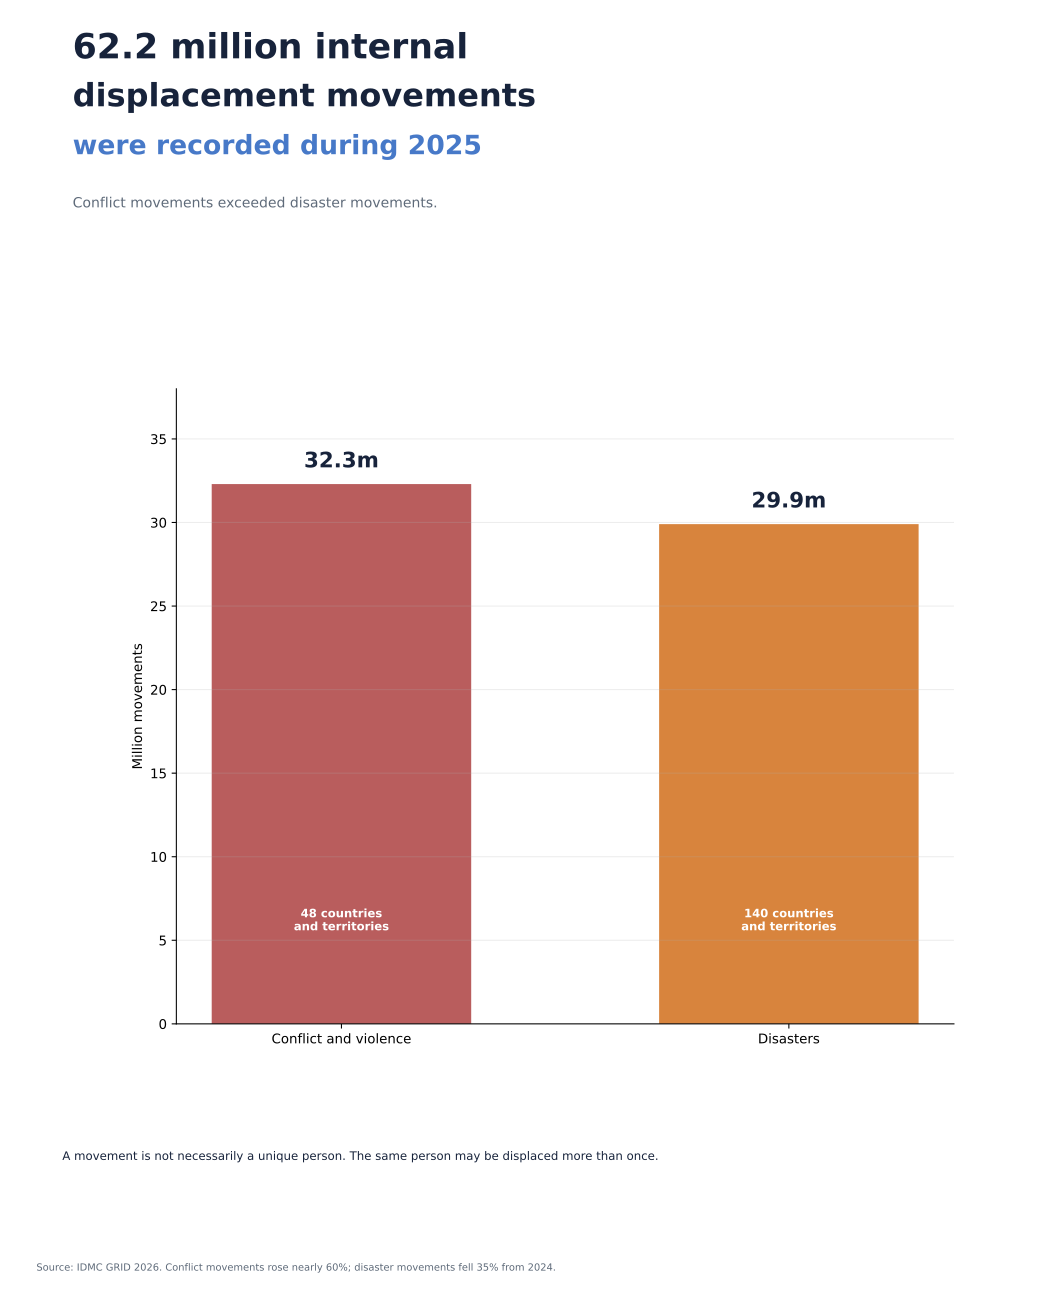
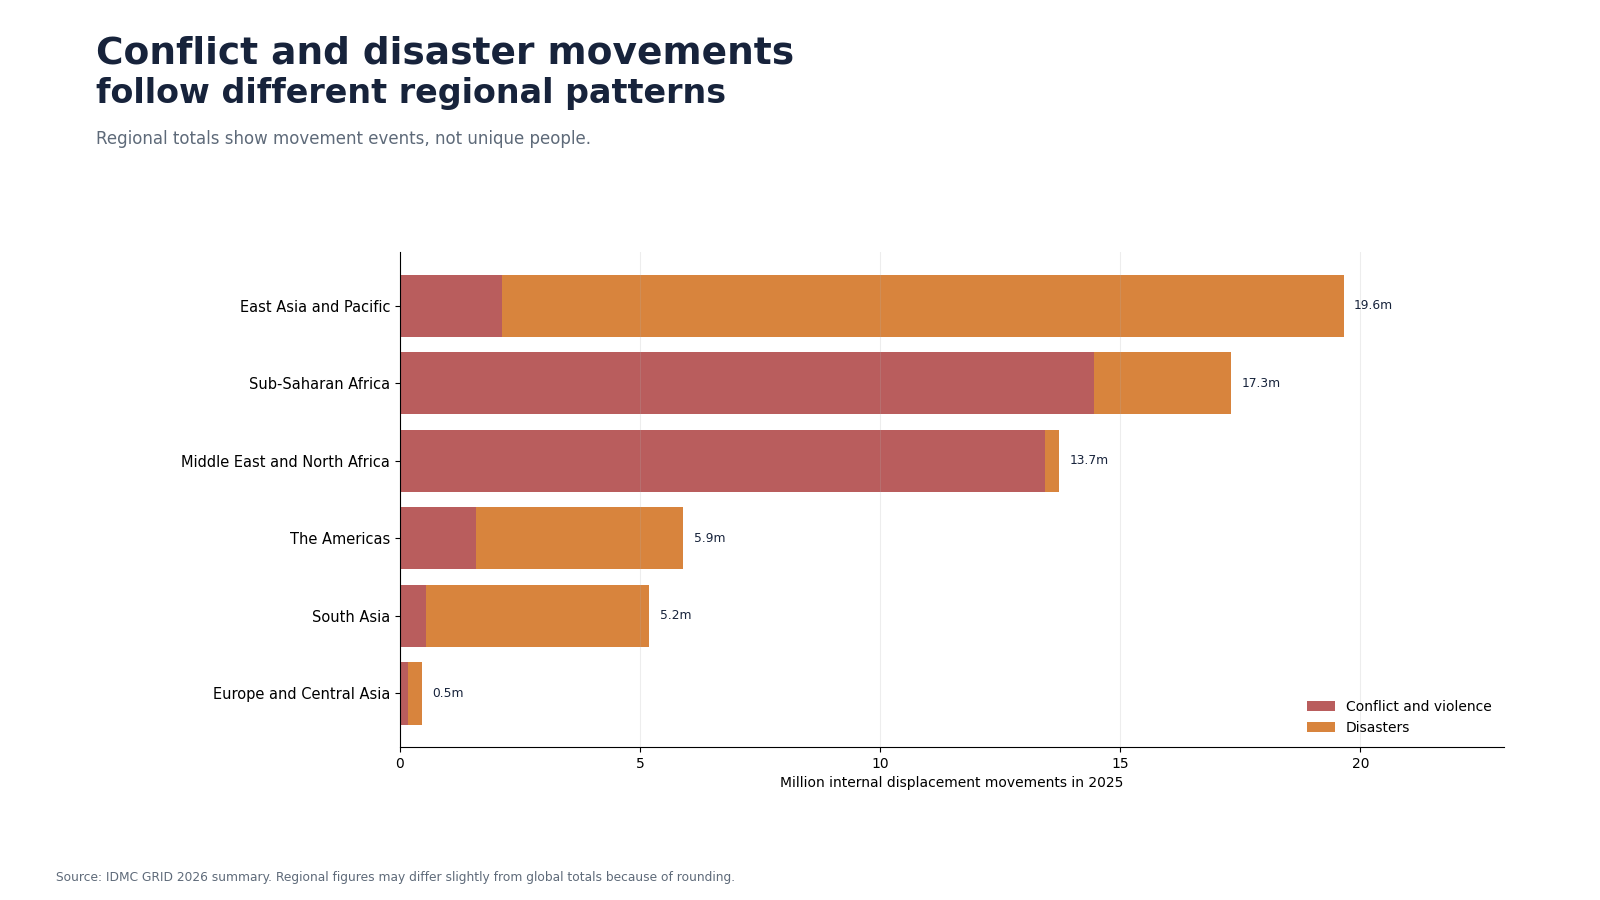
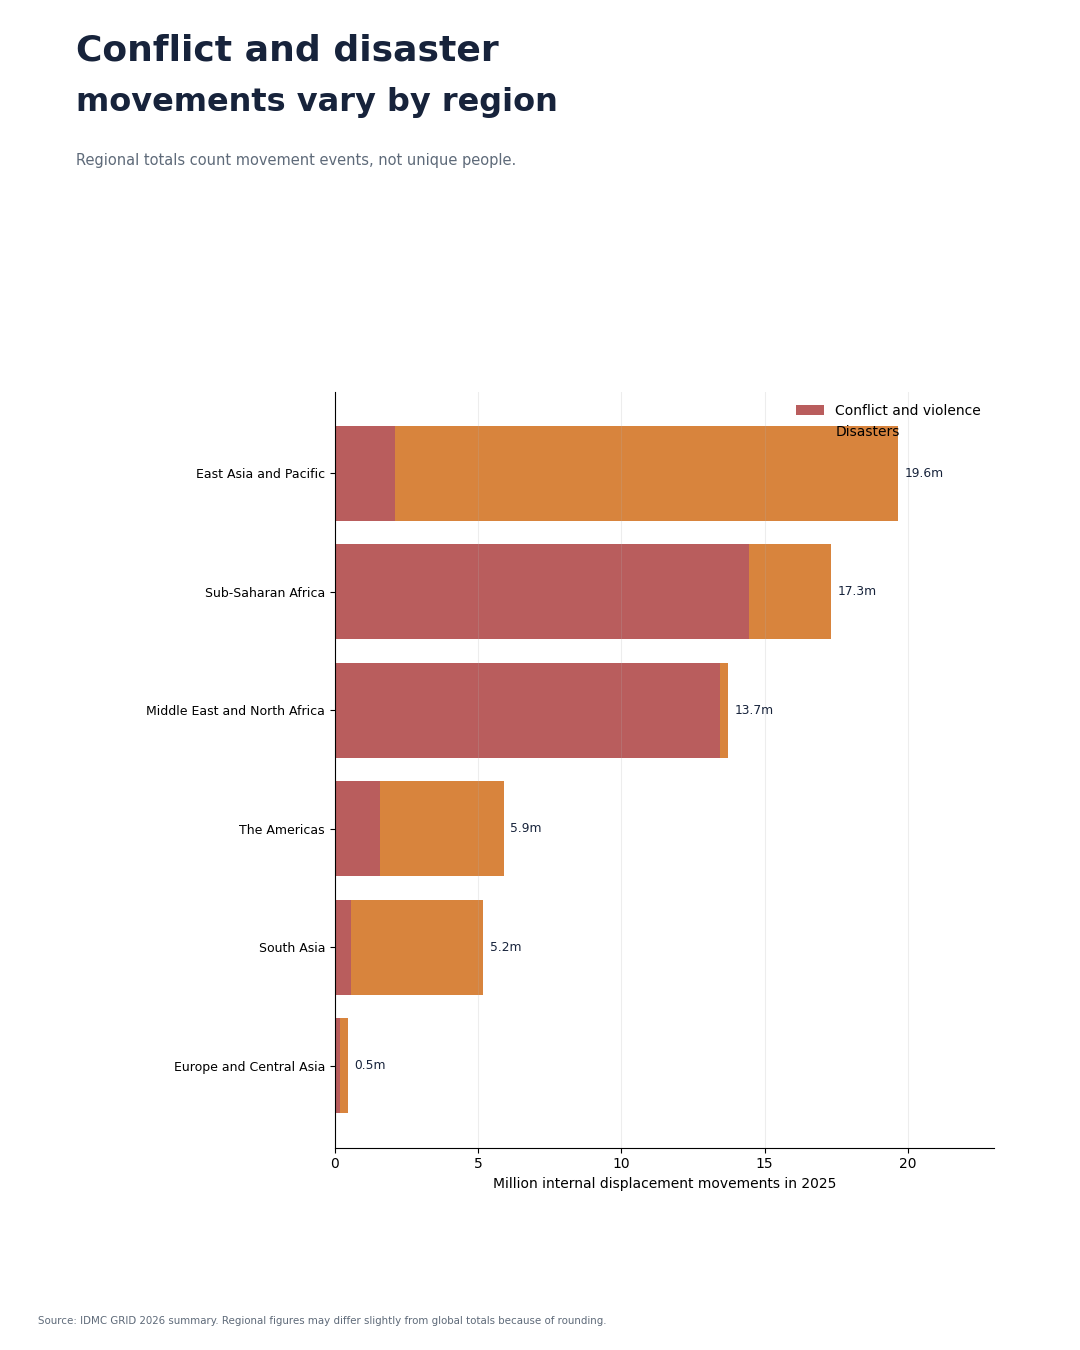
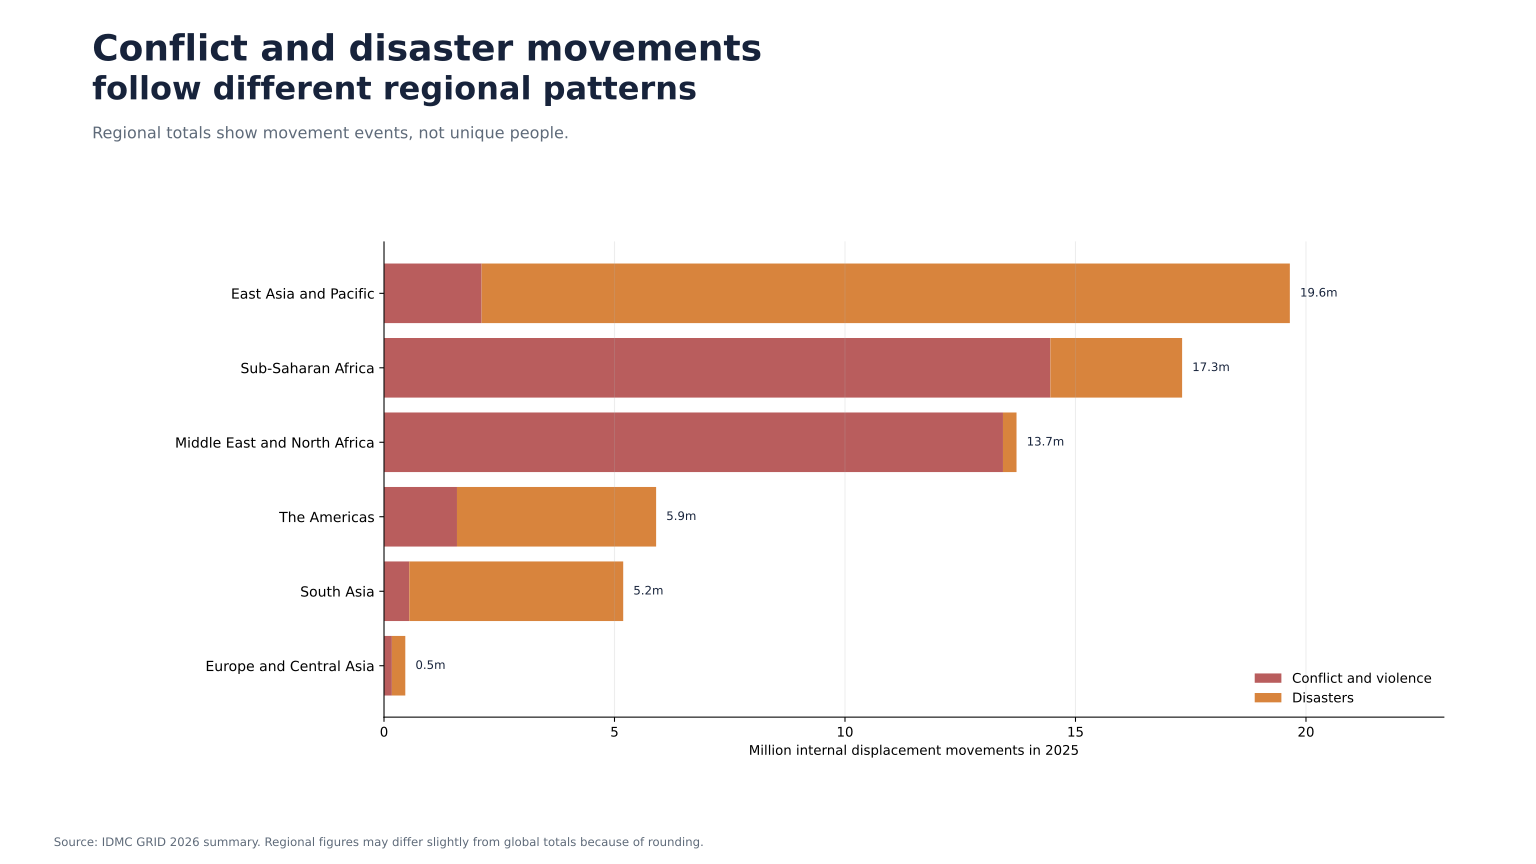
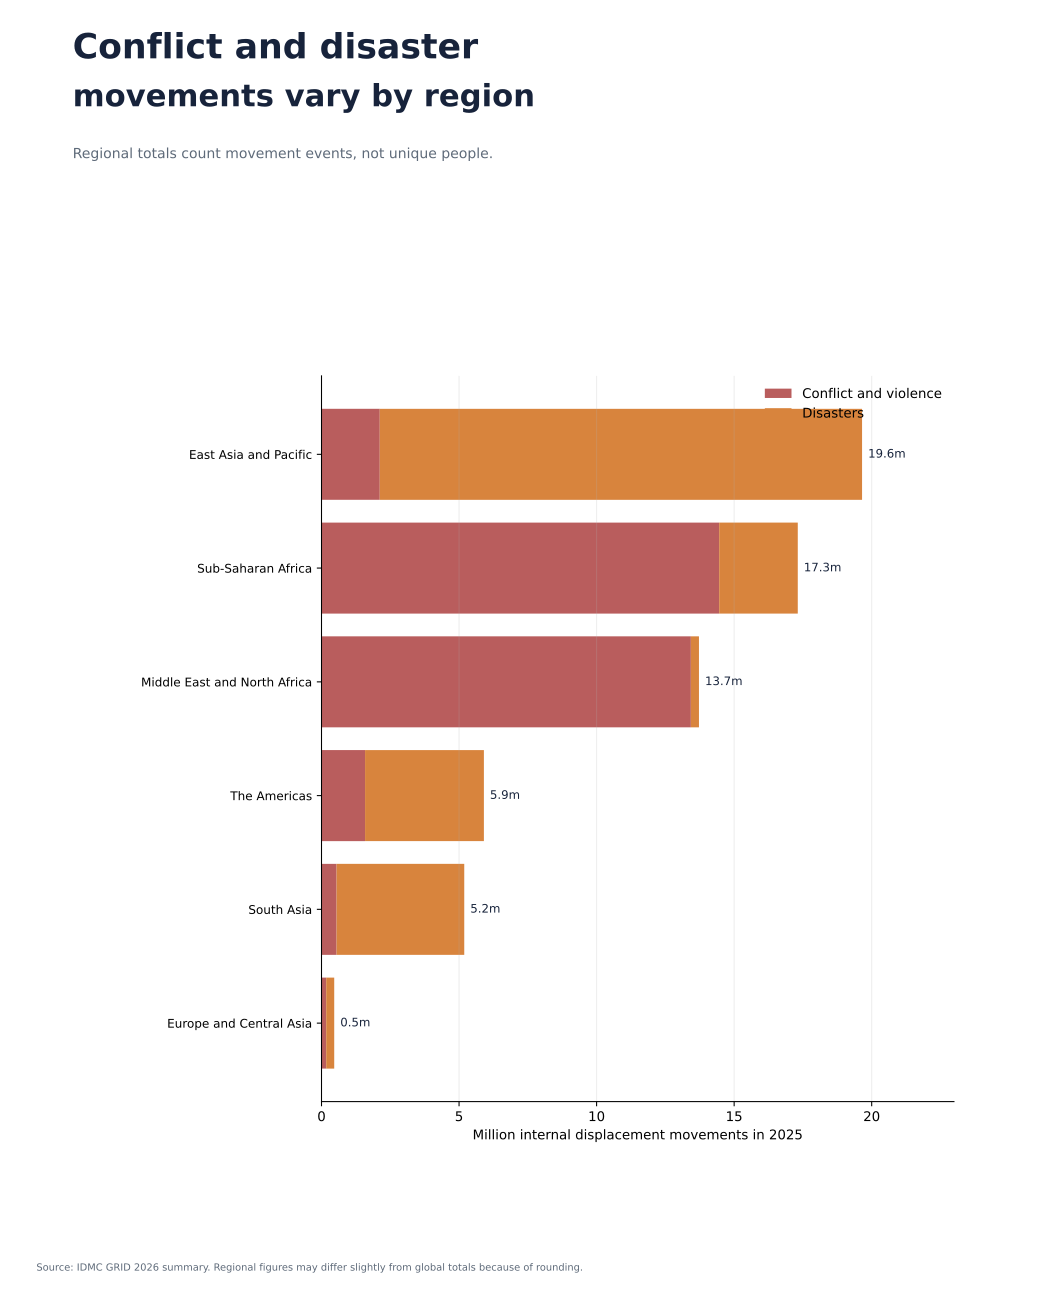
IDMC recorded 62.2 million internal displacement movements during 2025. Conflict and violence generated more movements than disasters for the first time. Movements are not unique people.

Some people in the year-end stock were displaced before 2025. Some people counted in the 2025 flow moved more than once and may not have remained displaced at year-end.

Disasters dominated movement counts in East Asia and the Pacific. Conflict and violence dominated in sub-Saharan Africa and the Middle East and North Africa.

| Measure | Question | Unit | Time basis |
|---|---|---|---|
| Refugees | How many people are outside their country and counted in refugee-related categories? | People | End-year stock |
| Refugee-like situations | How many people face refugee-like protection risks without formally ascertained status? | People; subset | End-year stock |
| Conflict IDP stock | How many people remain displaced inside their country by conflict or violence? | People | End-year stock |
| Disaster IDP stock | How many people remain displaced inside their country by disasters? | People | End-year stock |
| Internal displacements | How many times were people forced to move inside their country during the year? | Movements | Annual flow |
The useful comparison is conceptual, not arithmetic. WSI does not add stocks and flows or turn unlike categories into one total-displacement ranking.
What these measures mean
Downloads
Seven pages with all six charts.
Open PDFTwo pages with the main distinctions.
Open PDFWide/mobile PNG and SVG charts plus CSV data.
Download ZIPMethods: source and methods note. Official sources: UNHCR Global Trends 2025 and IDMC GRID 2026.
Related visual brief
Four measures of hunger and malnutrition answer four different questions.