At a glance
Four headline numbers - four different universes
News reports about hunger often use very different figures. The numbers can all be accurate because they cover different people, periods, geographic universes, experiences, and outcomes.
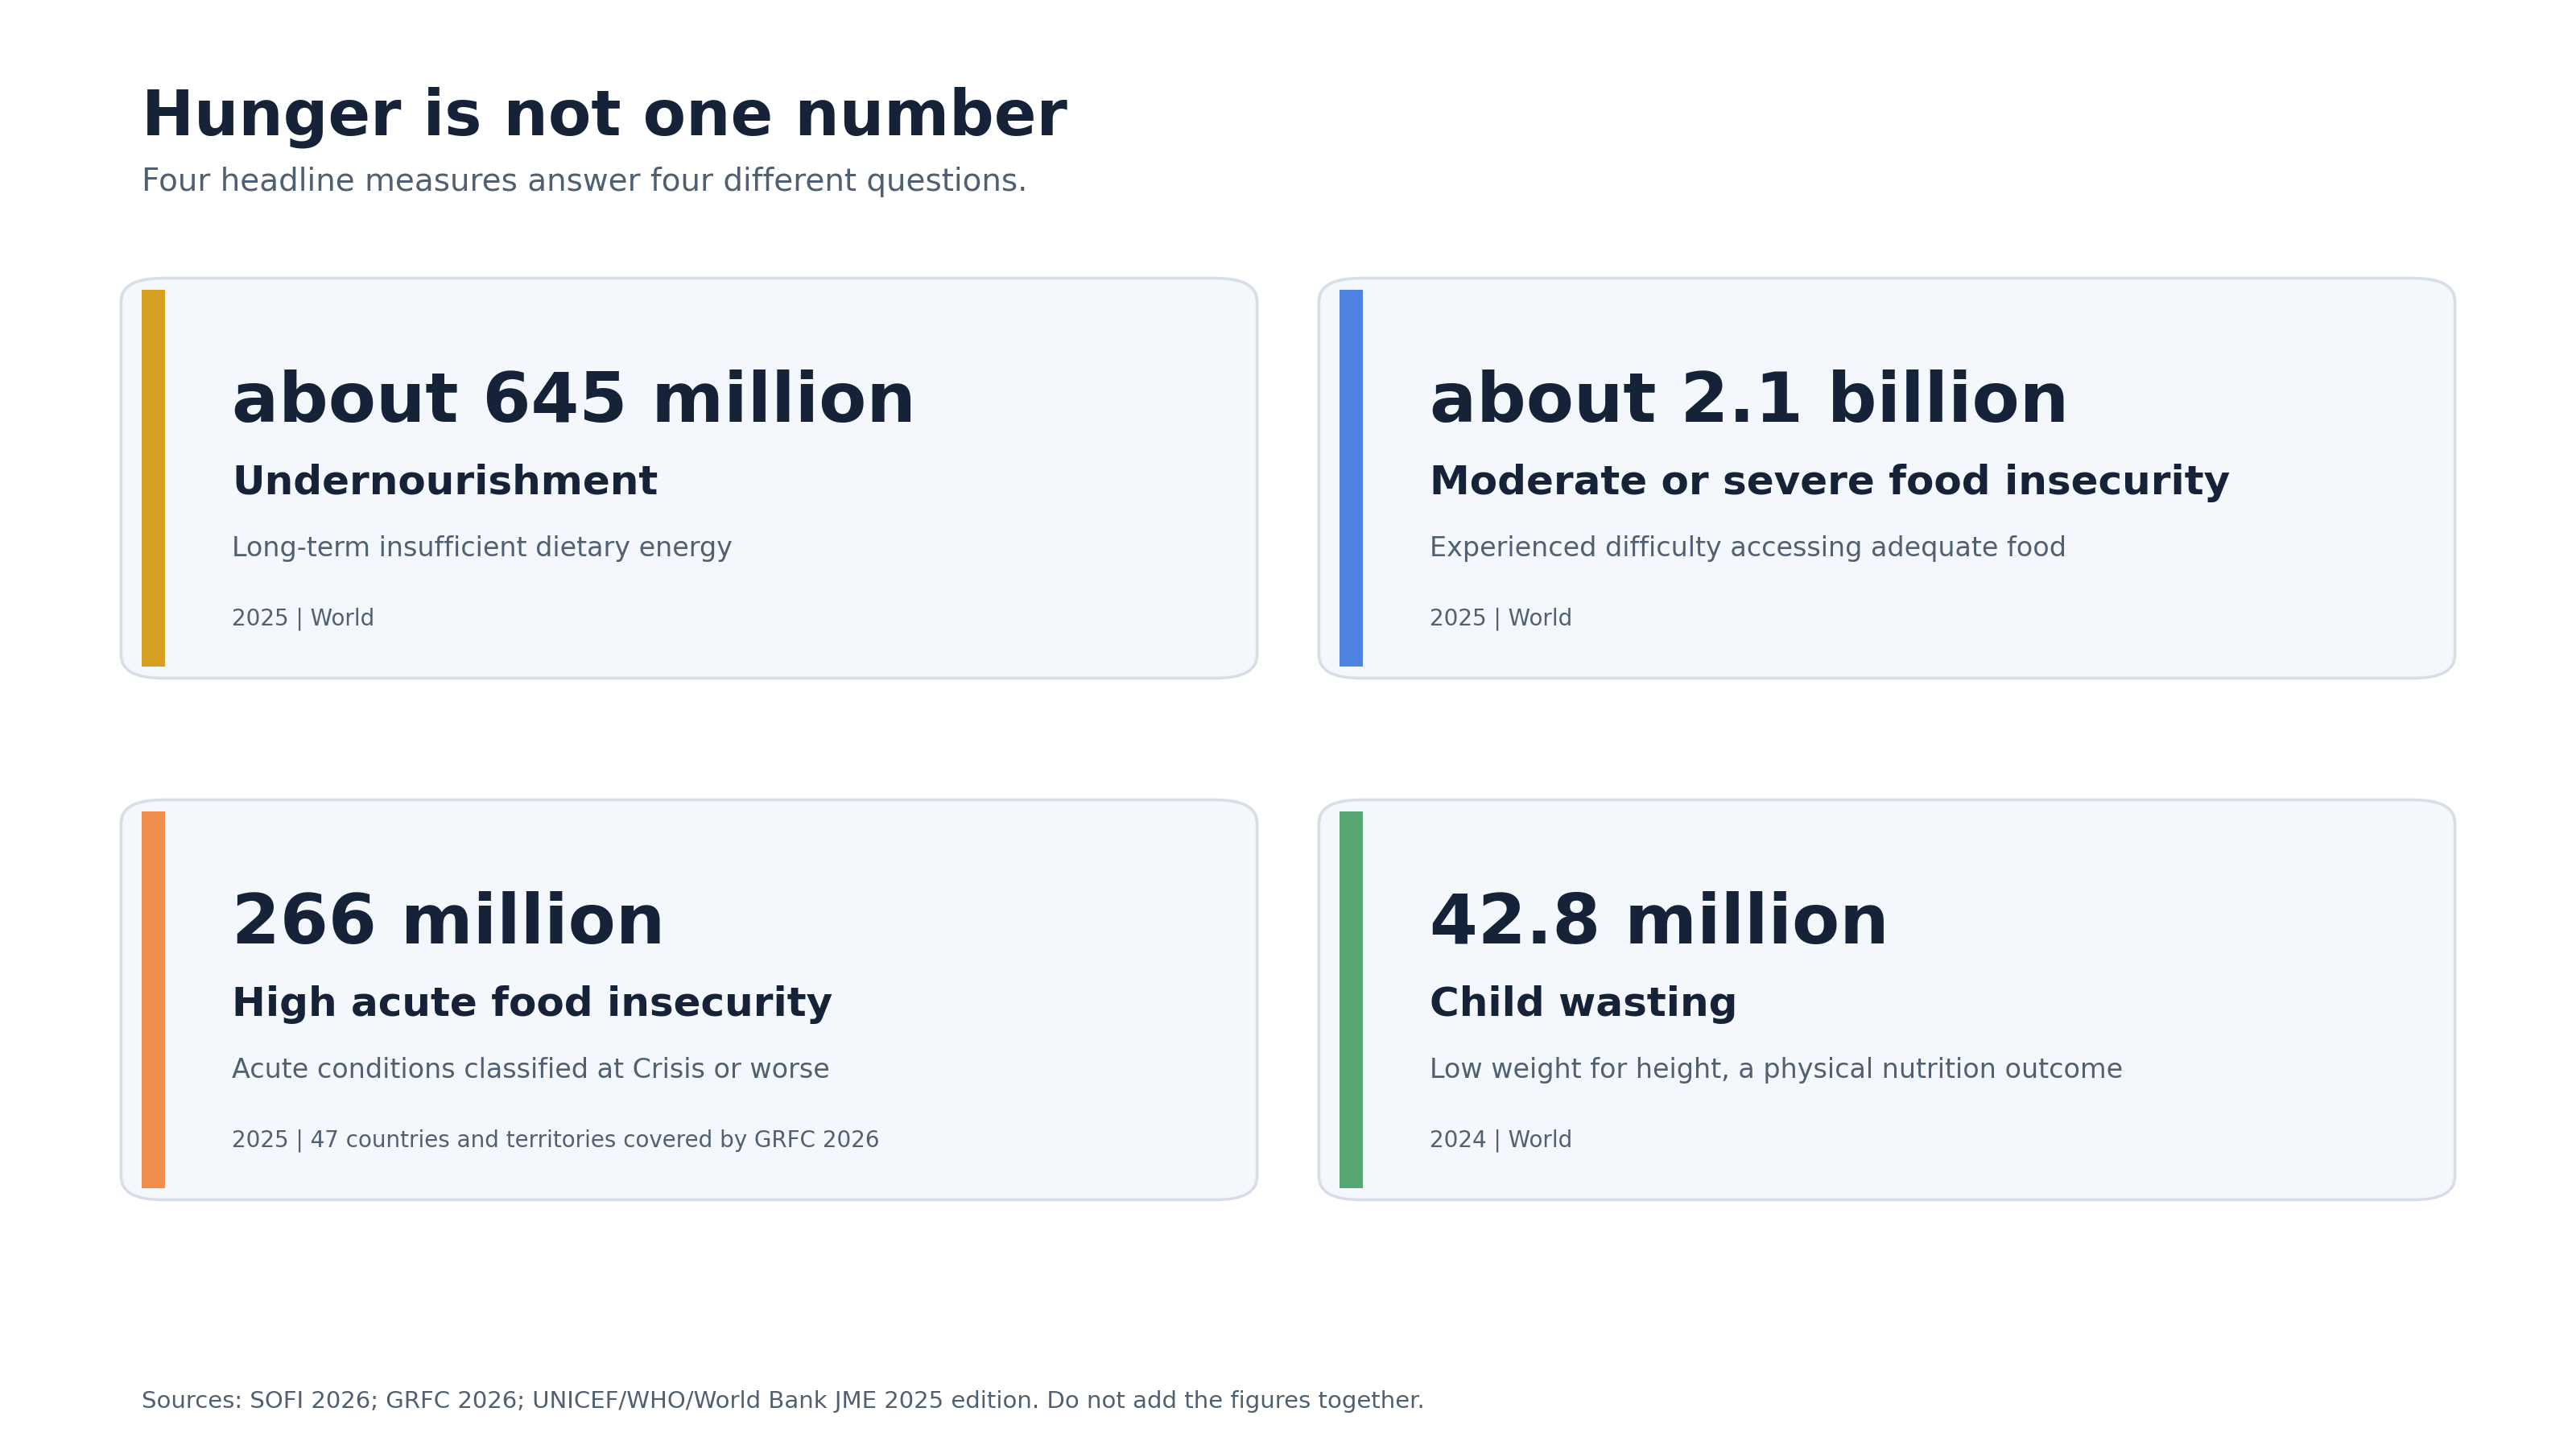
WSI Visual Brief
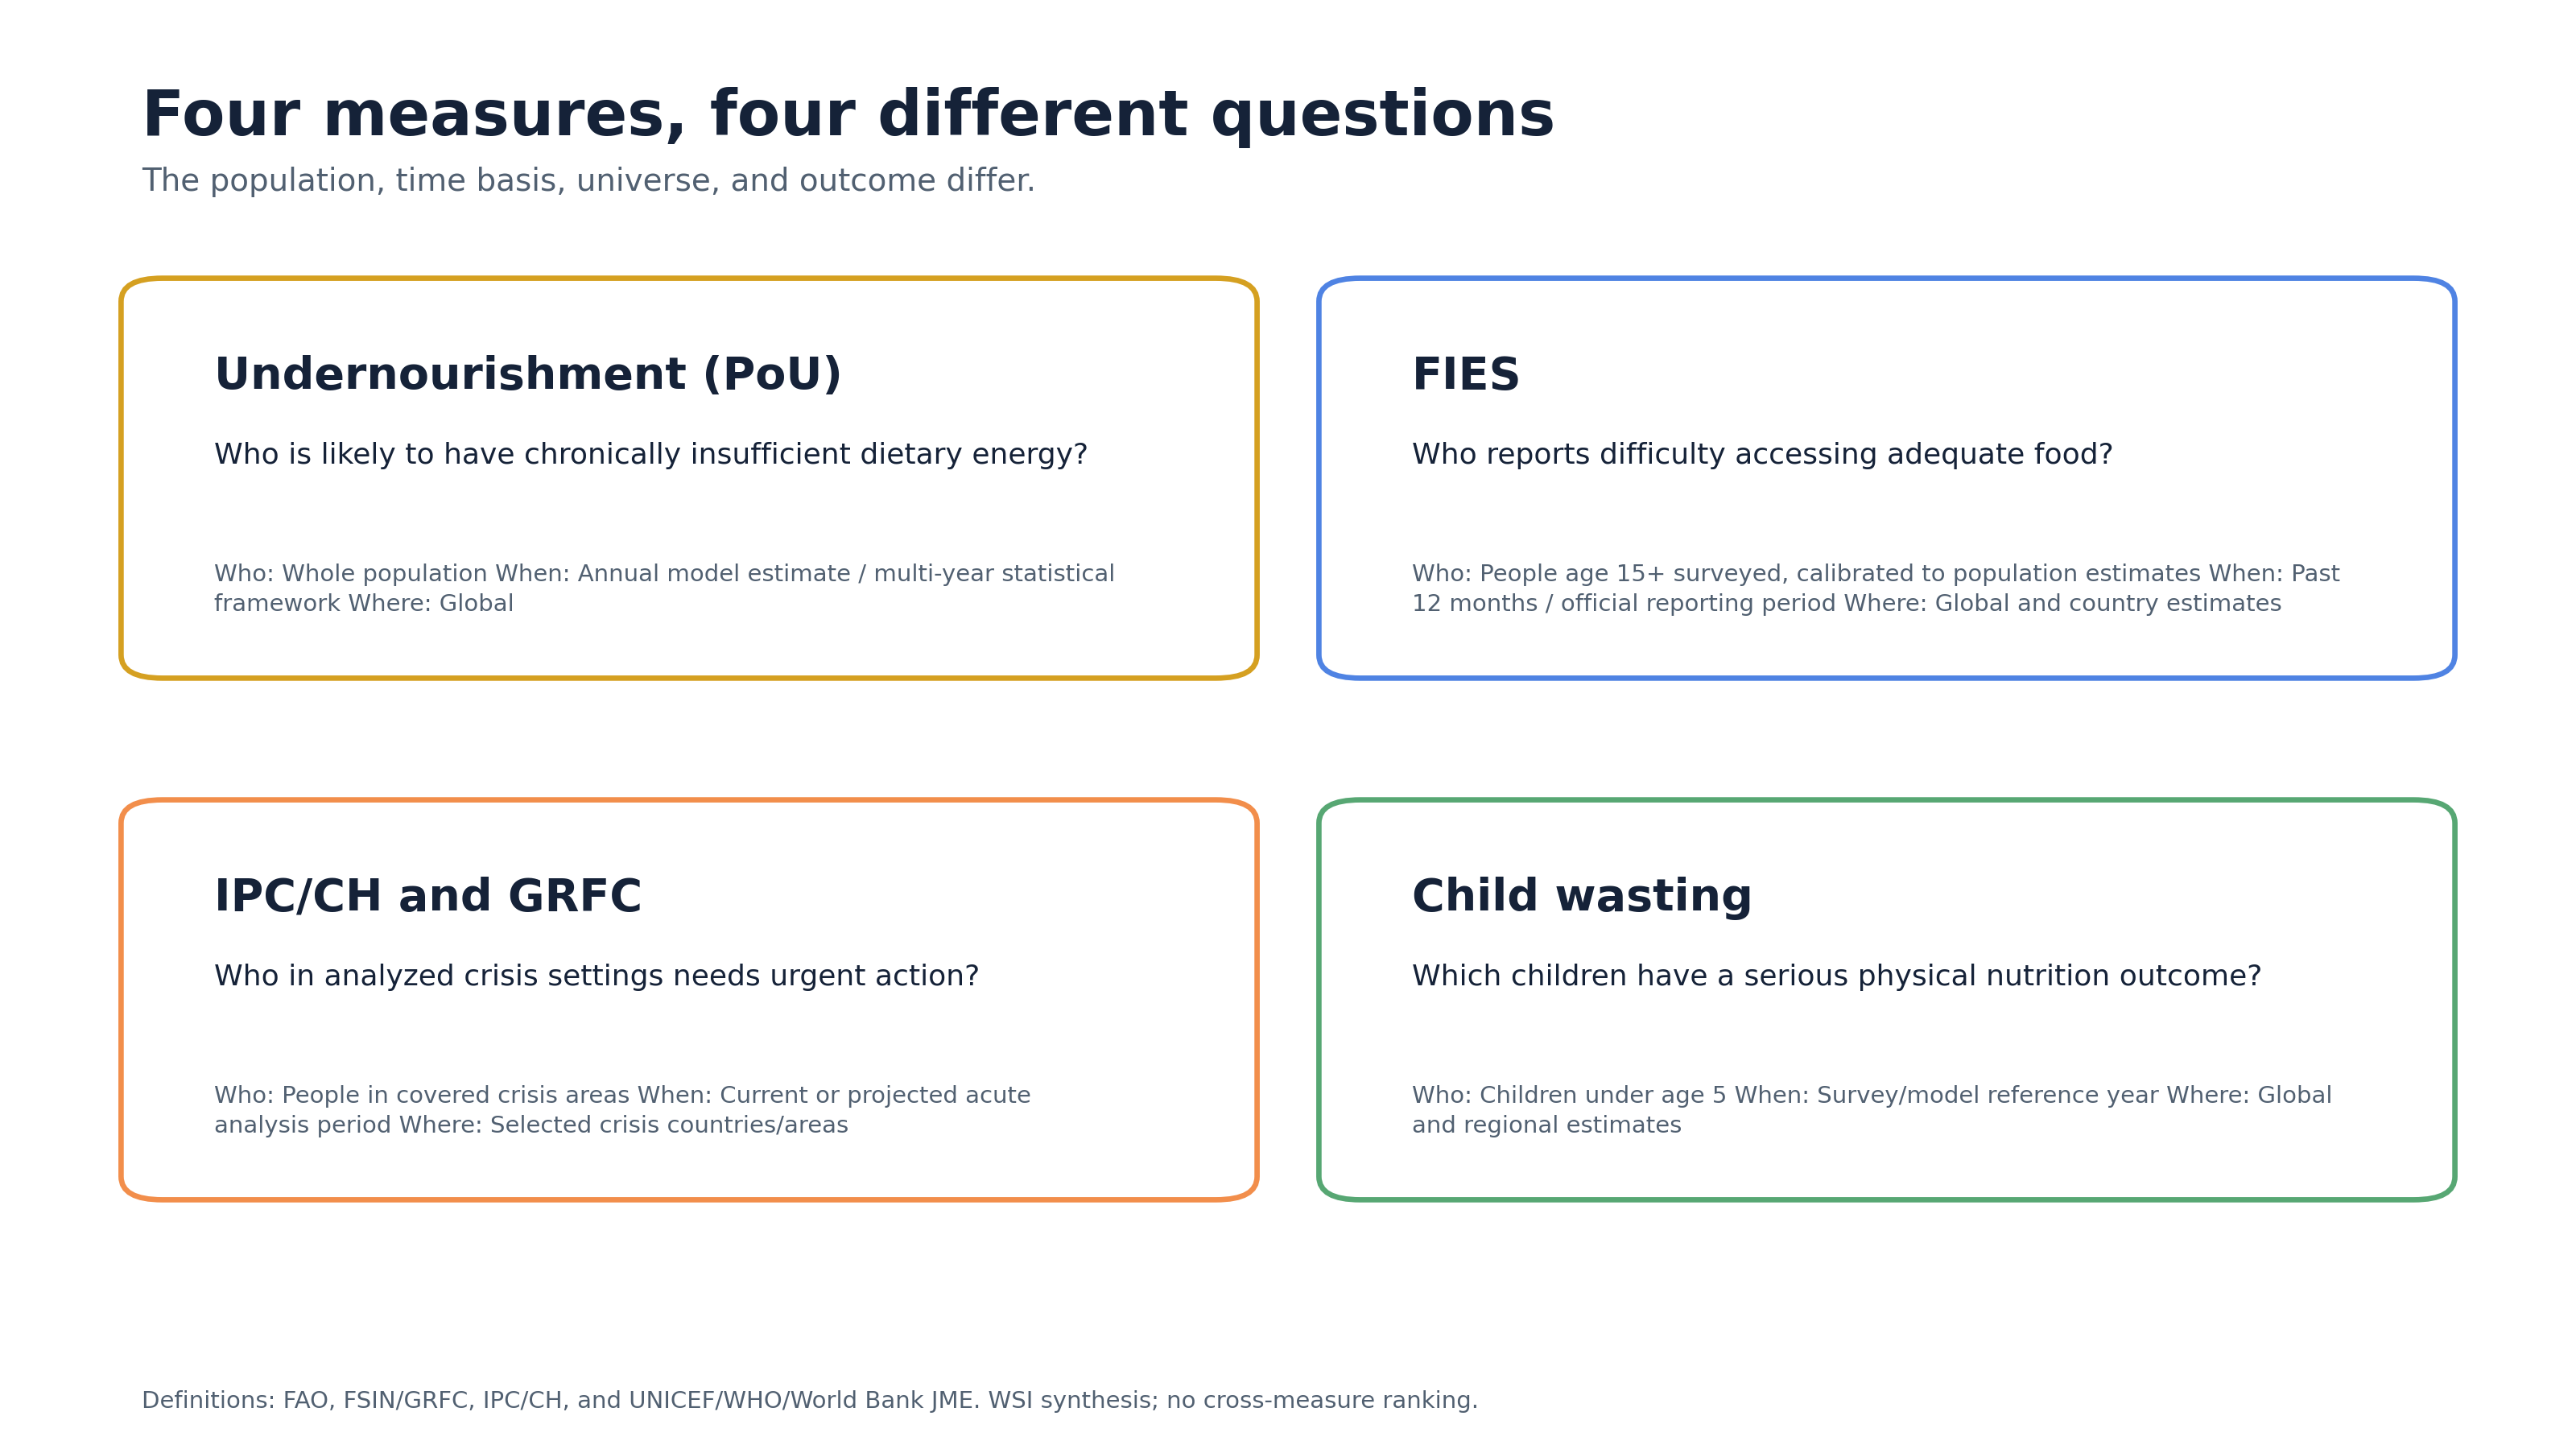
Four measures that answer four different questions.
Chronic hunger, food-access difficulty, acute food crises, and child wasting are related. They are not interchangeable, and their headline figures should not be added together.
At a glance
News reports about hunger often use very different figures. The numbers can all be accurate because they cover different people, periods, geographic universes, experiences, and outcomes.
Undernourishment concerns long-term dietary-energy inadequacy. FIES records lived difficulty accessing adequate food. Acute food-insecurity systems classify urgent conditions in analysed crisis settings. Wasting is a physical child-nutrition outcome.
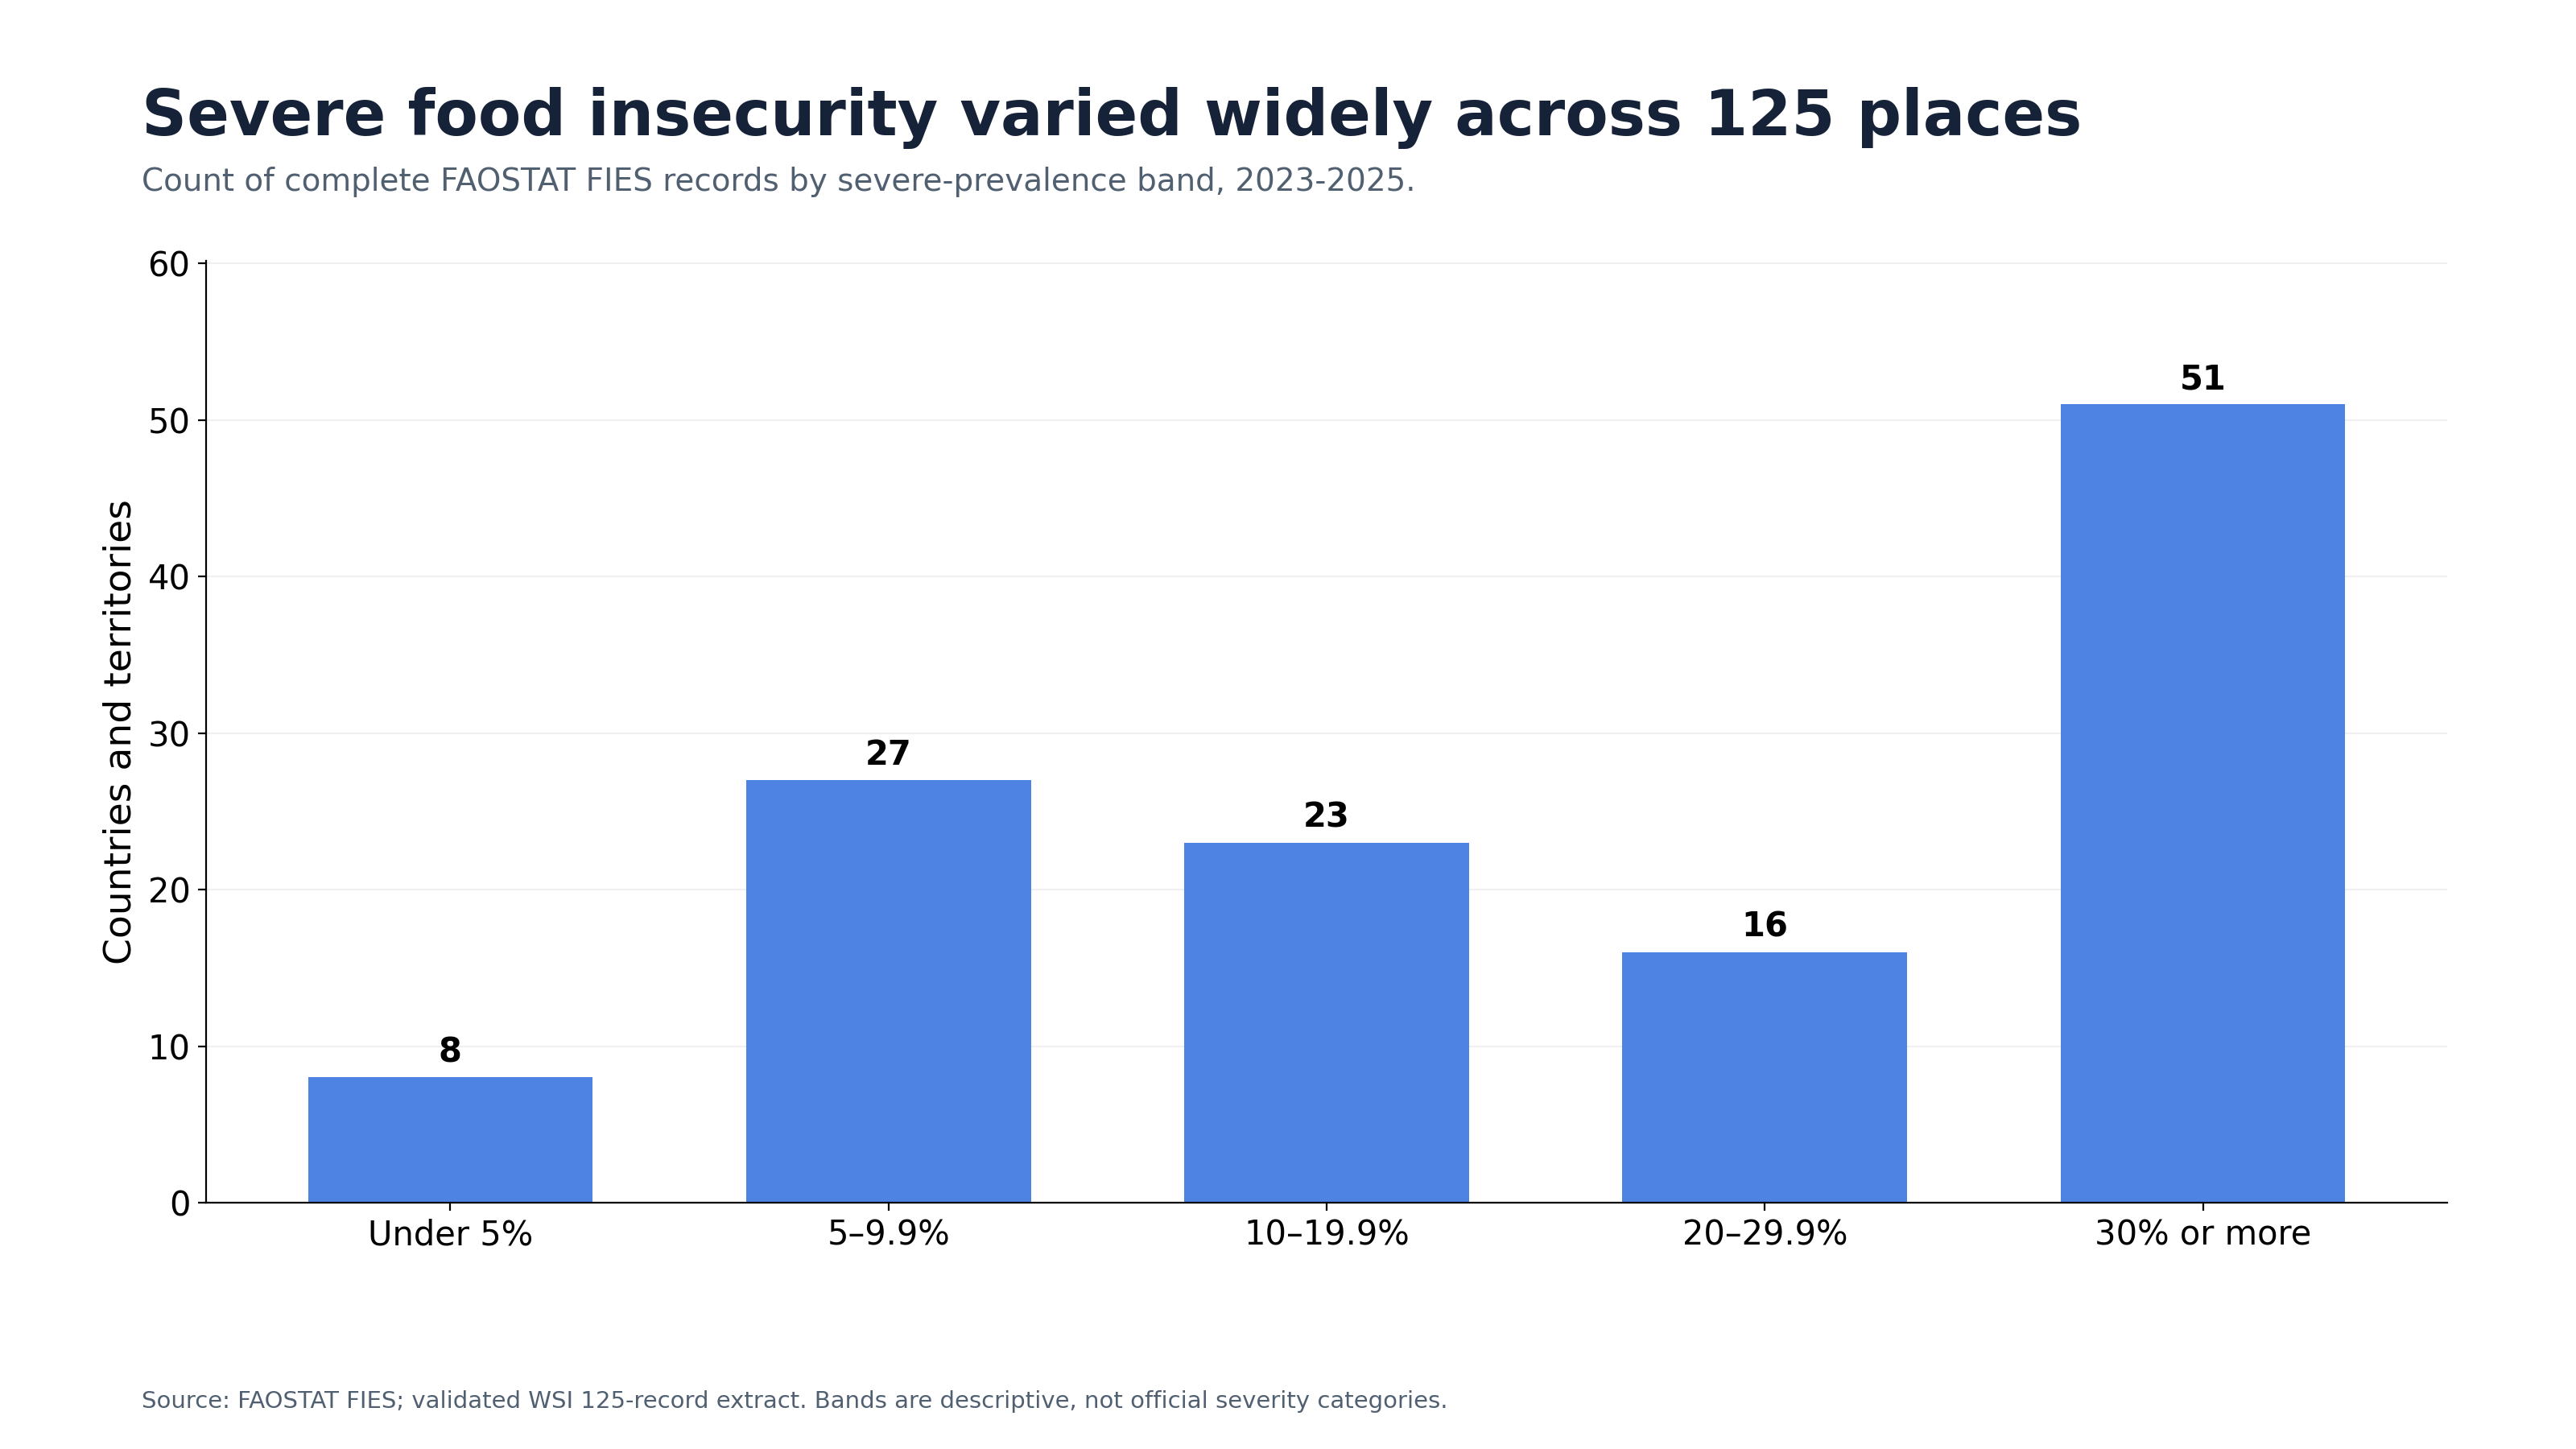
The completed WSI FIES profile contains 125 country or territory records with matched 2023-2025 prevalence estimates. The bands show the distribution without creating a country league table.
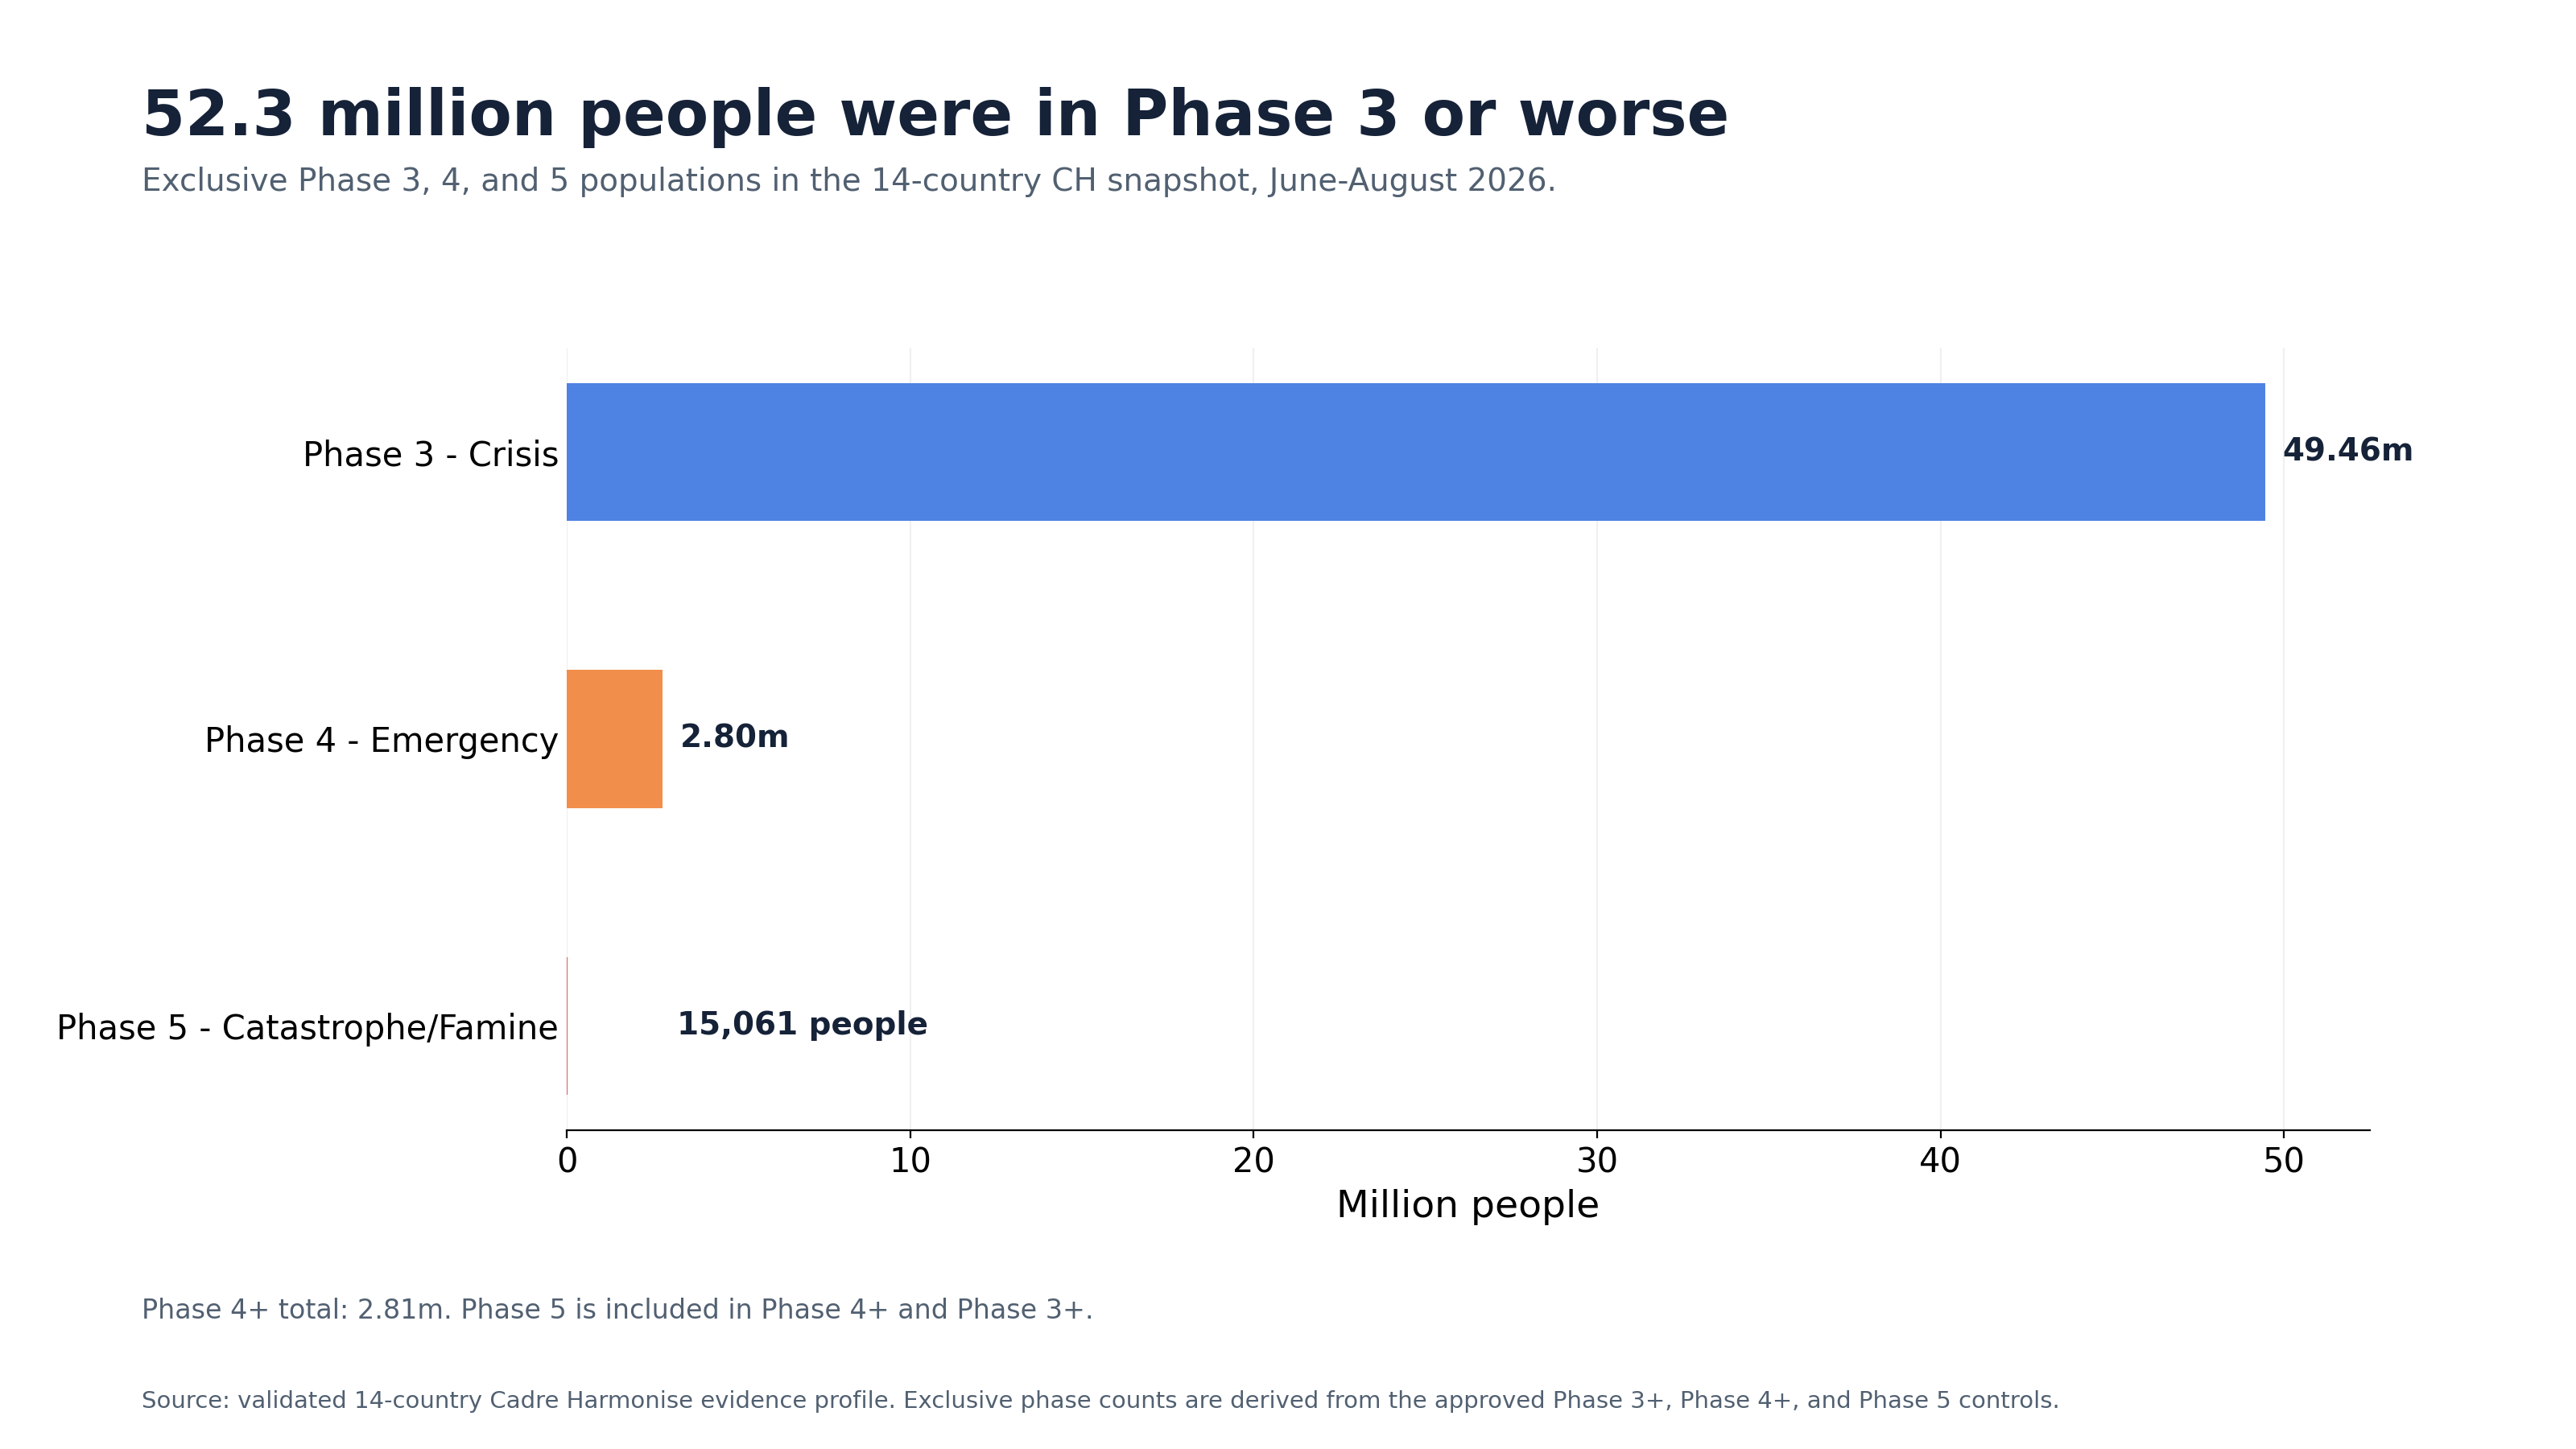
Across the validated 14-country Cadre Harmonise snapshot, 52.3 million people were in Phase 3 or worse. The corrected chart shows mutually exclusive Phase 3, Phase 4, and Phase 5 populations.
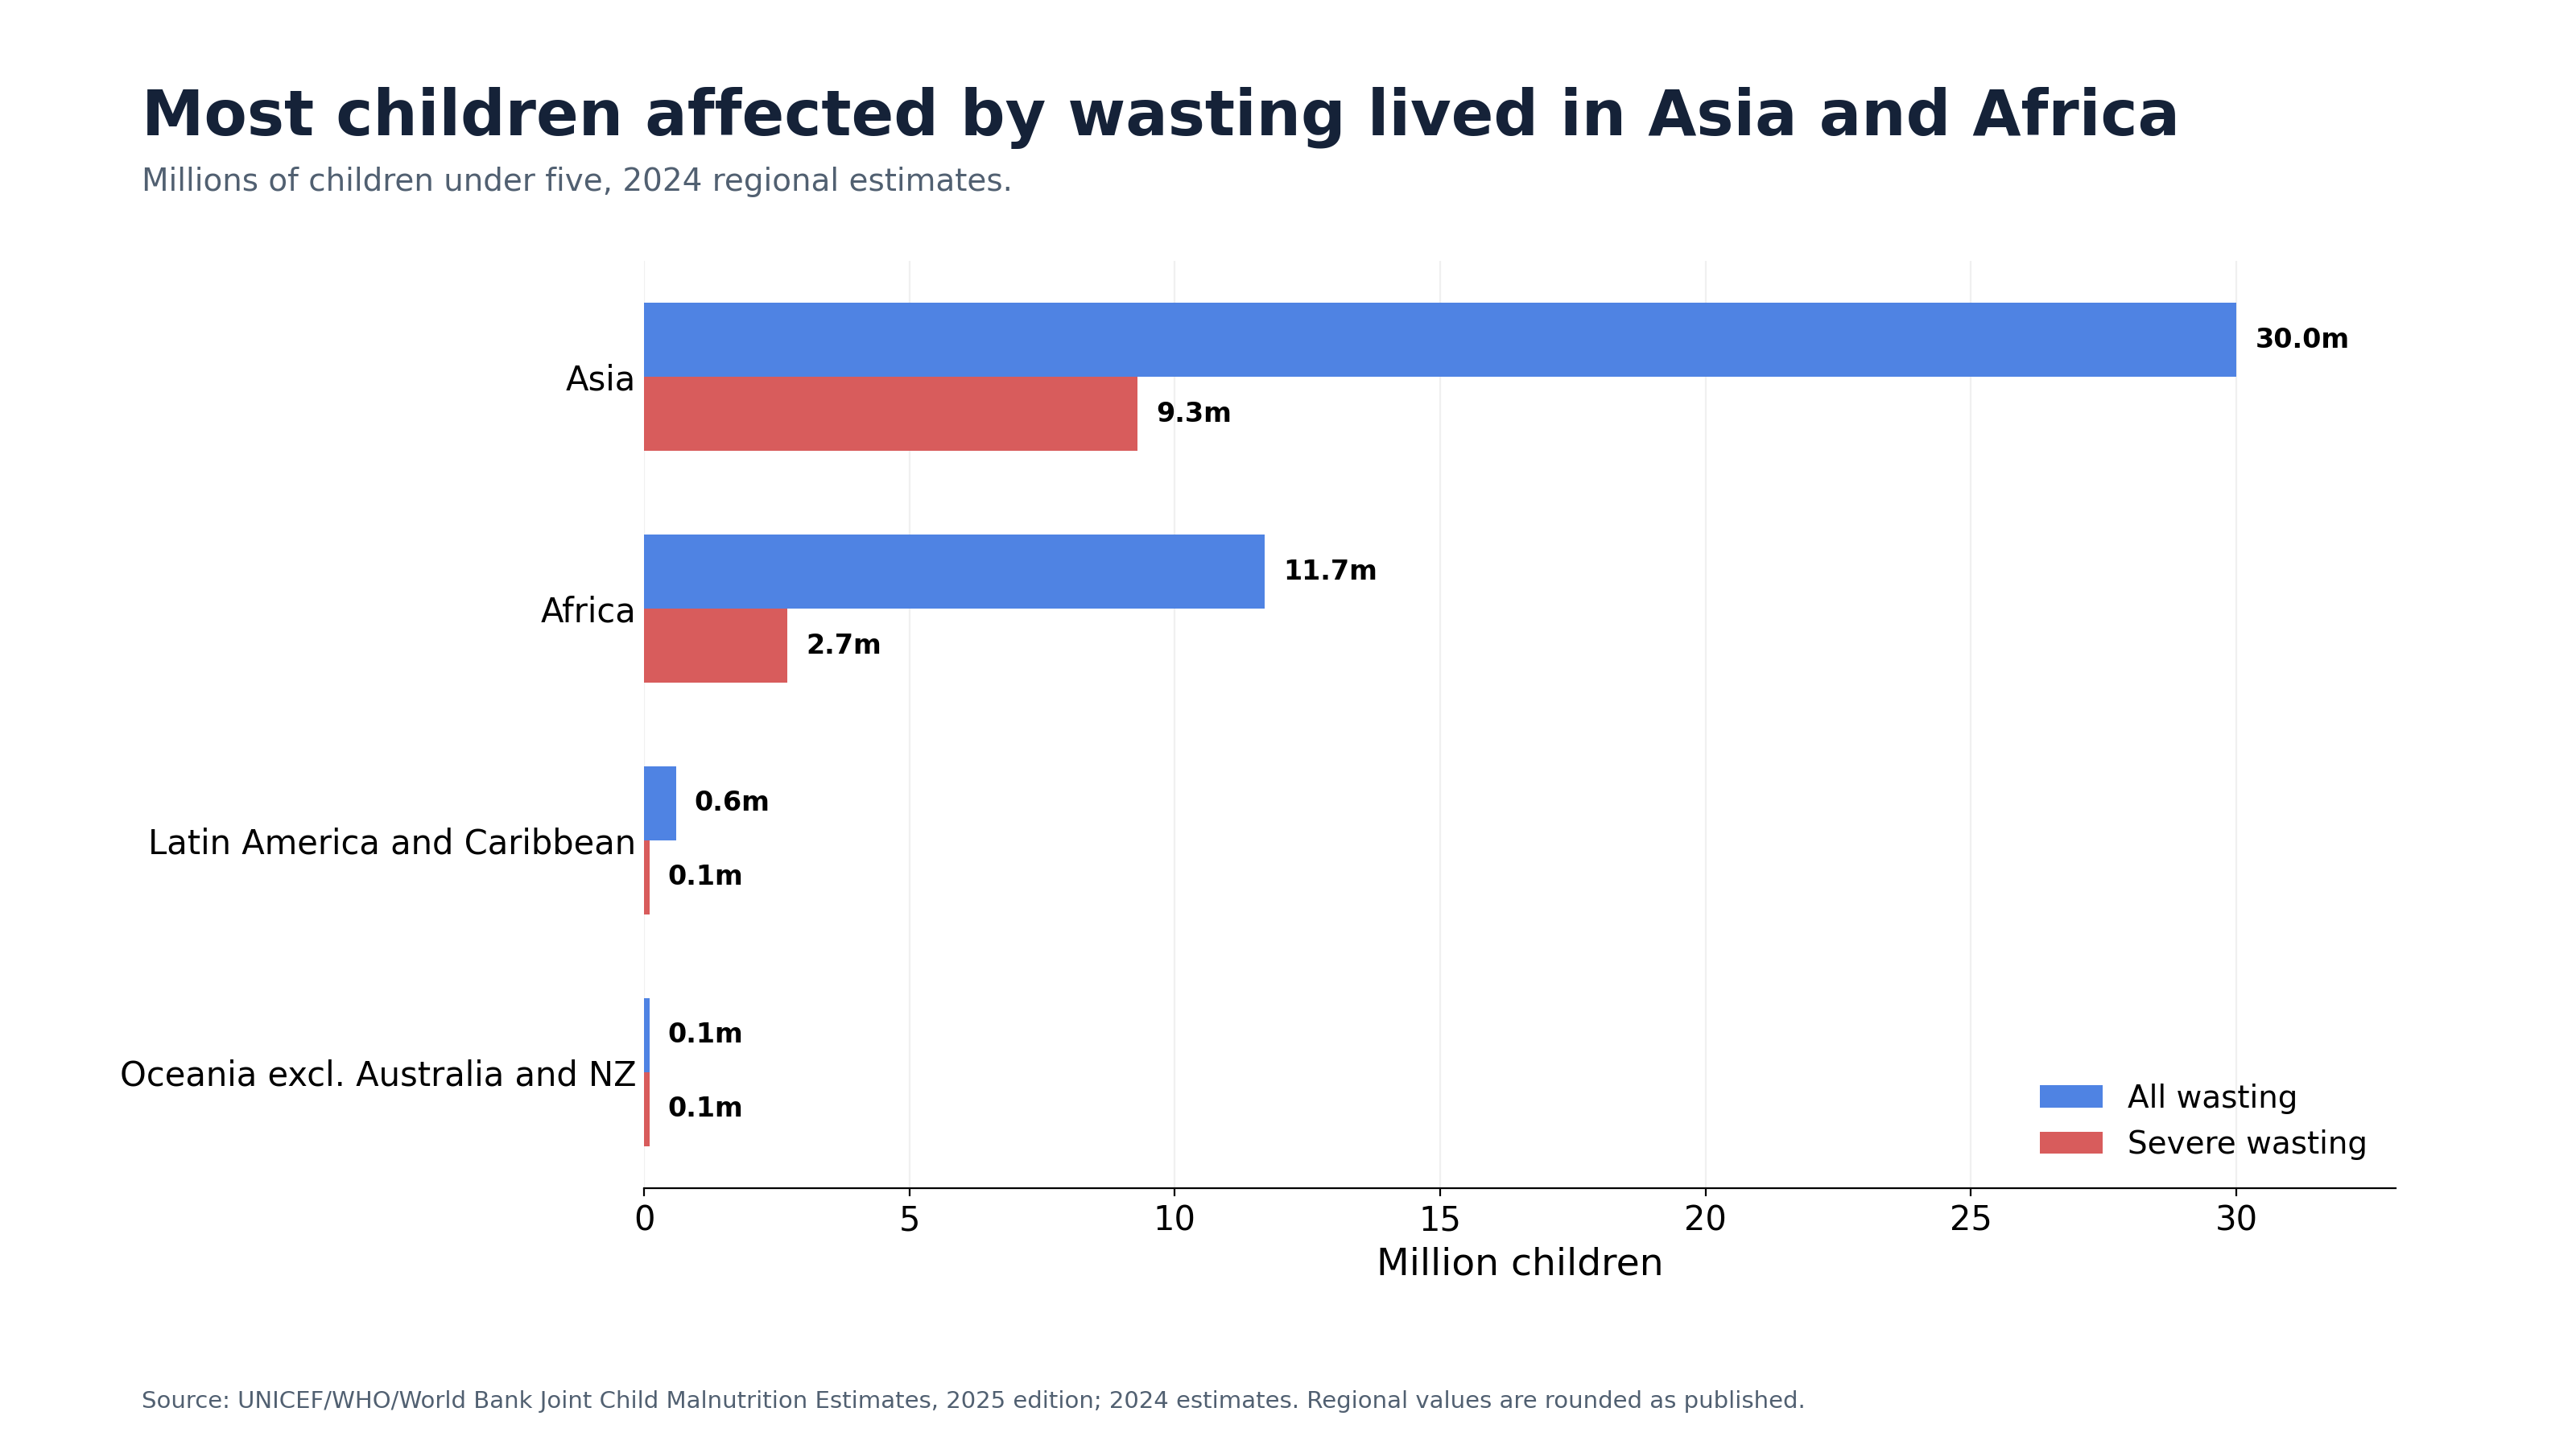
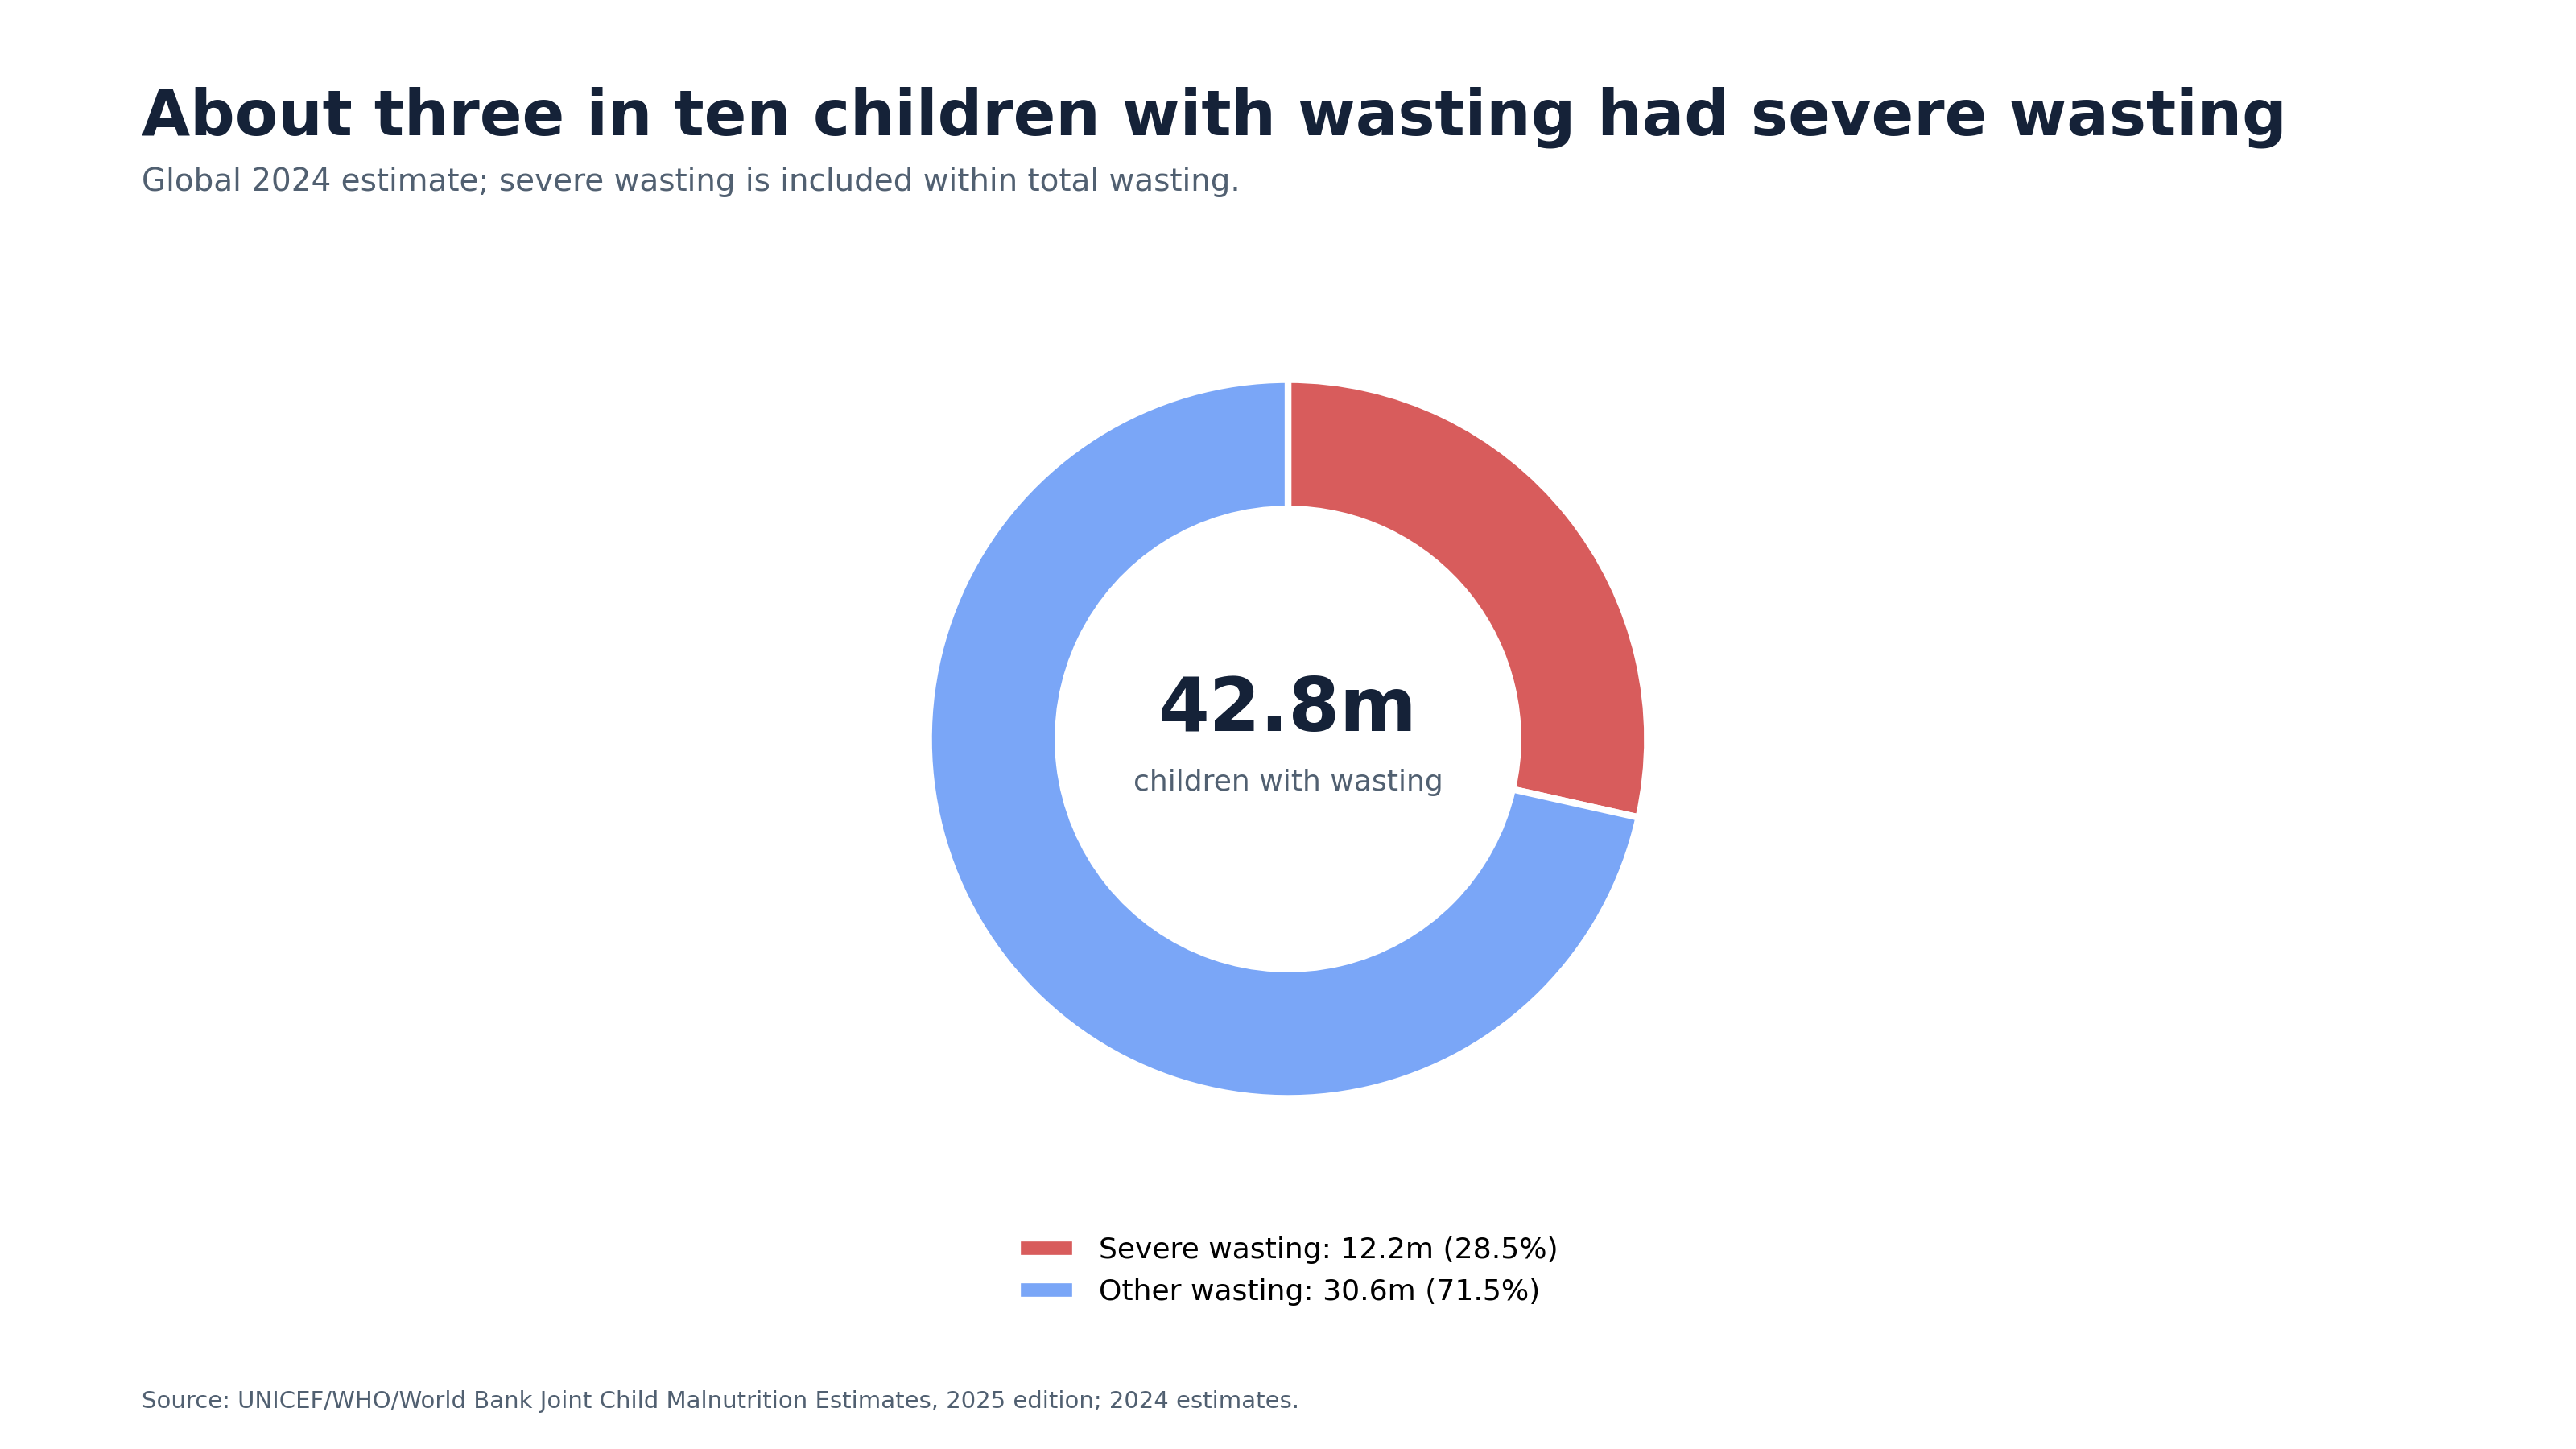
The 2025 JME edition estimated 42.8 million children under five with wasting in 2024, including 12.2 million with severe wasting. Regional figures are rounded as published.
Severe wasting accounted for about 28.5% of the global number of children with wasting in 2024. It is not an additional population to add to the total.
| Measure | Question | Universe | Time basis |
|---|---|---|---|
| Undernourishment (PoU) | Who is likely to have chronically insufficient dietary energy? | Global | Annual model estimate / multi-year statistical framework |
| FIES | Who reports difficulty accessing adequate food? | Global and country estimates | Past 12 months / official reporting period |
| IPC/CH and GRFC | Who in analyzed crisis settings needs urgent action? | Selected crisis countries/areas | Current or projected acute analysis period |
| Child wasting | Which children have a serious physical nutrition outcome? | Global and regional estimates | Survey/model reference year |
The useful comparison is conceptual, not arithmetic. WSI does not add the four populations or turn them into a cross-measure ranking.
What these measures mean
Downloads
Seven pages with all six redesigned charts.
Open PDFTwo pages with the main distinctions.
Open PDFWide PNG, mobile PNG, font-safe SVG, and chart-data CSV files.
Download ZIPMethods: source and methods note.
USU Research
This visual brief is based on source evidence. Experimental USU models were not used to combine or rank the four measures.