Chart pack
Wide and mobile PNGs, font-safe SVGs, and CSV files.
Download ZIPWSI Data Story
Cases, severe cases, deaths, and rates answer different questions.
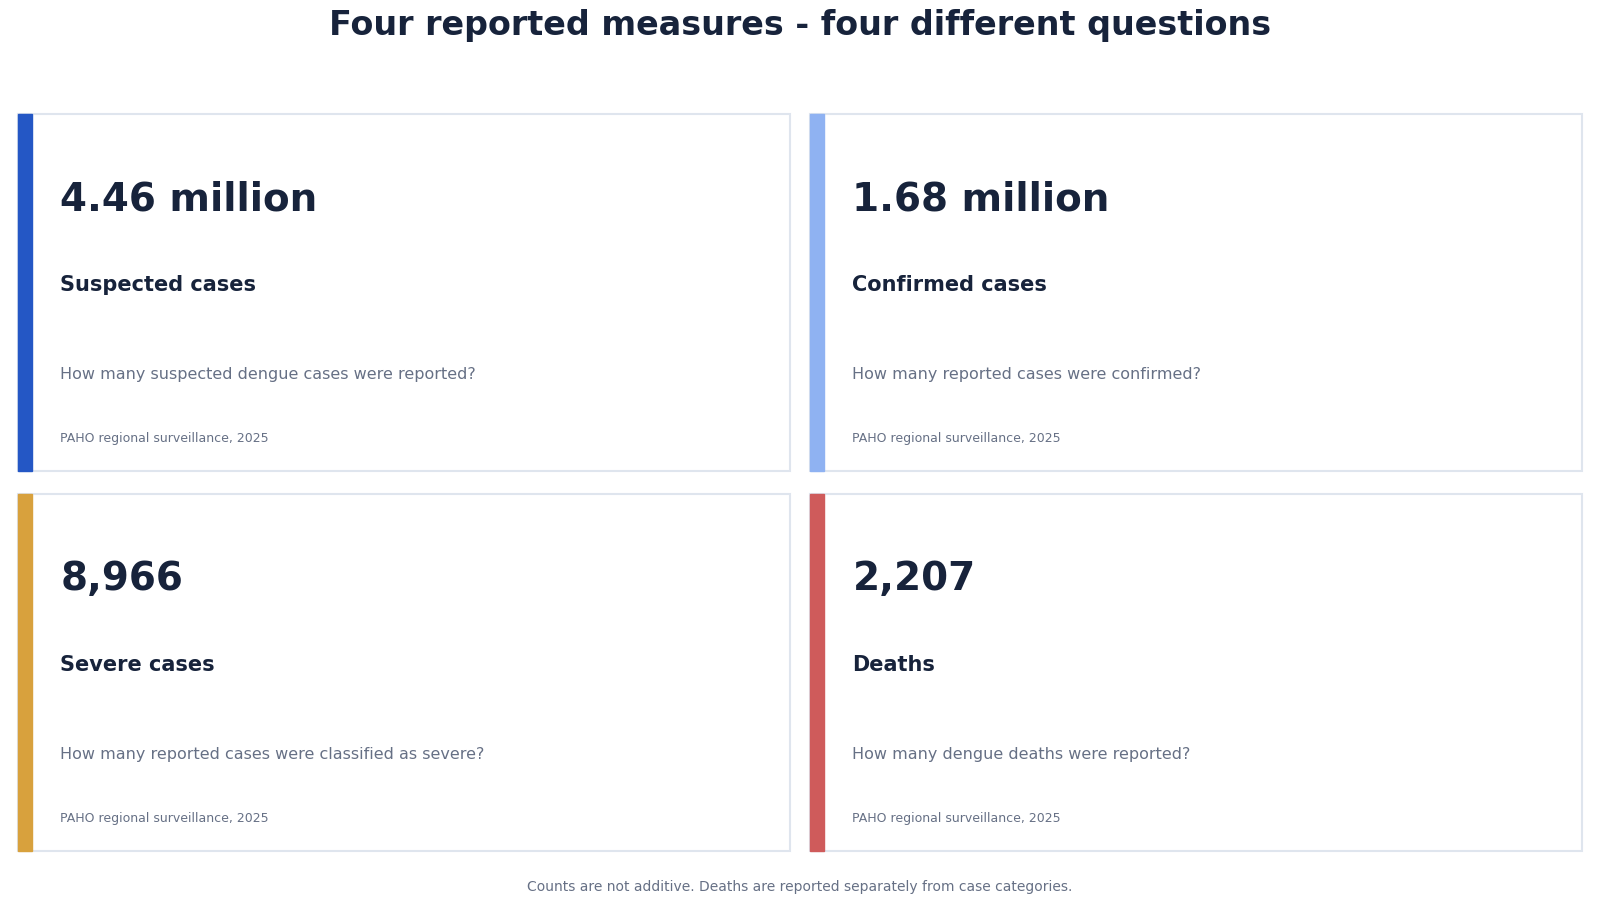
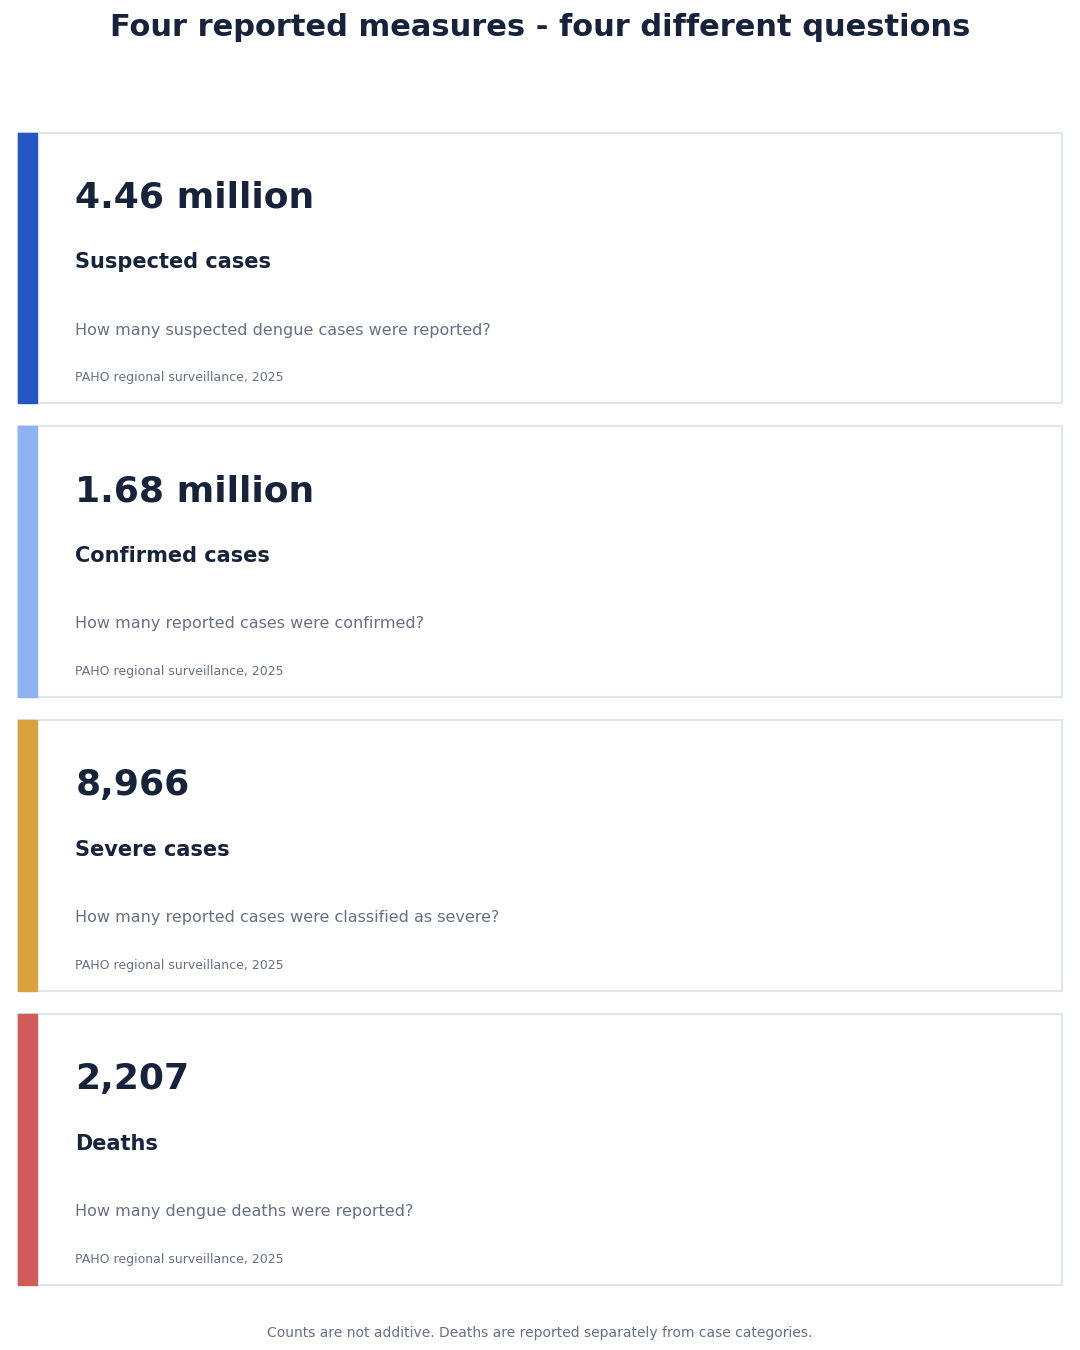
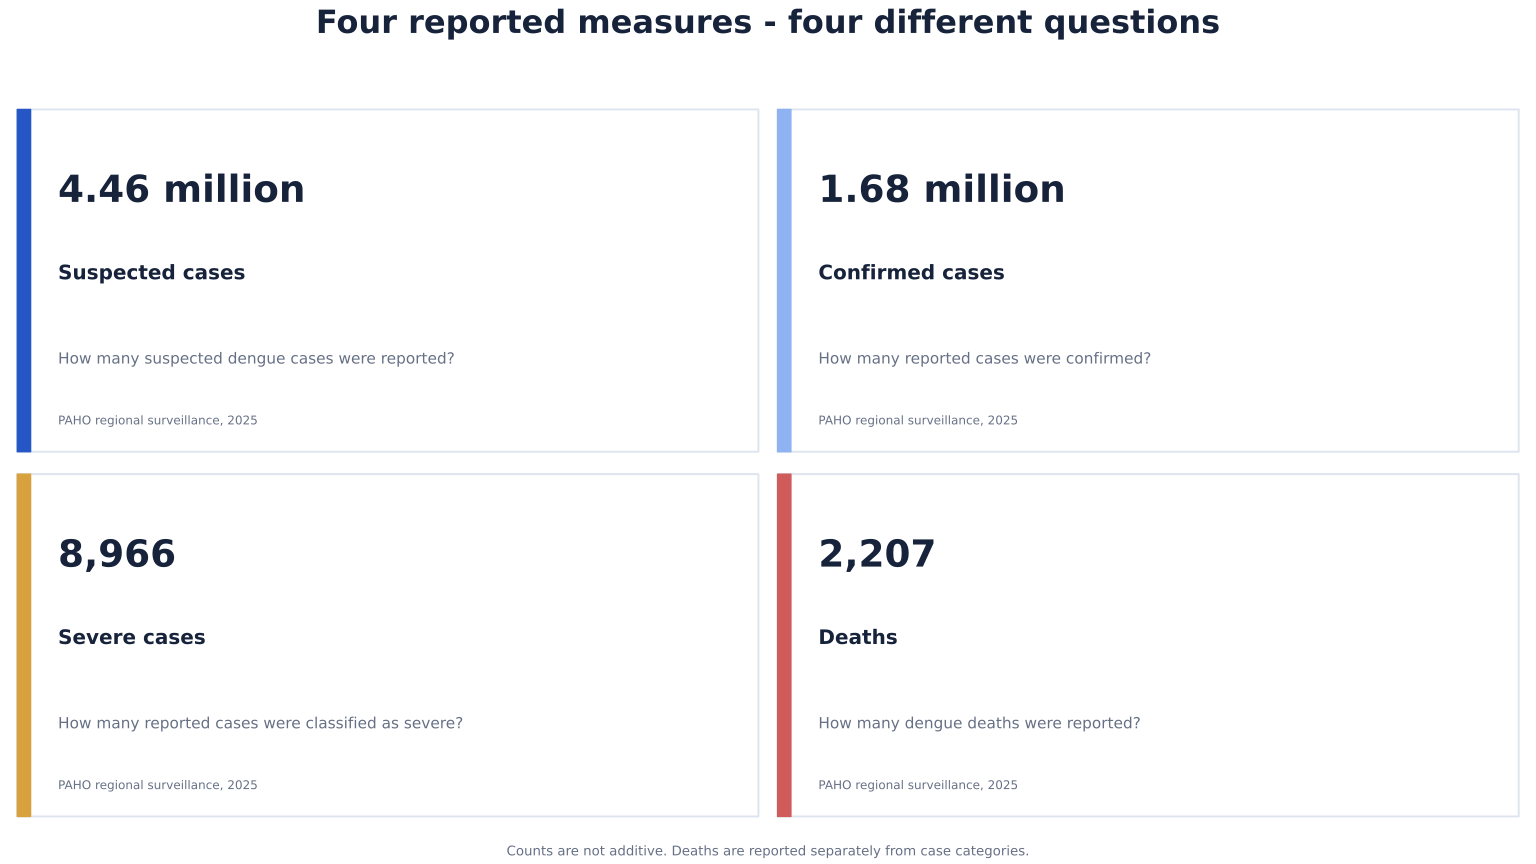
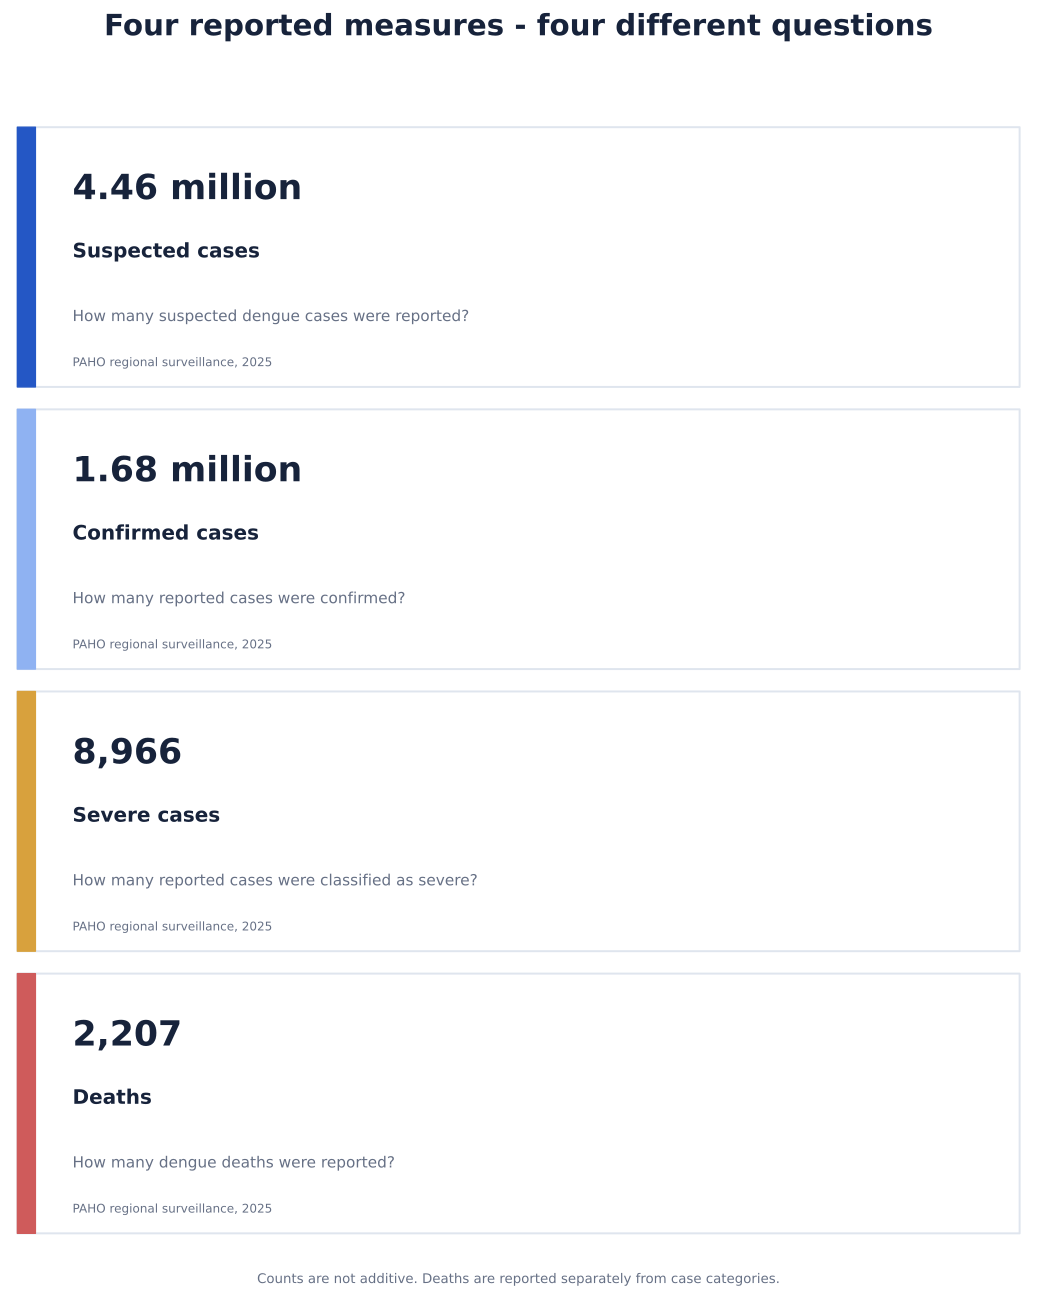
PAHO reported 4.46 million suspected cases in 2025. Confirmed and severe cases are subsets of that surveillance total. Deaths are outcomes, and rates depend on the denominator. None of these figures should be added together.
At a glance
Regional surveillance reported 4,459,521 suspected dengue cases across the Americas during epidemiological weeks 1-53 of 2025. Of those reports, 1,682,588 were confirmed and 8,966 were classified as severe. PAHO also recorded 2,207 deaths. The figures belong in the same evidence story, but they are not four separate populations.

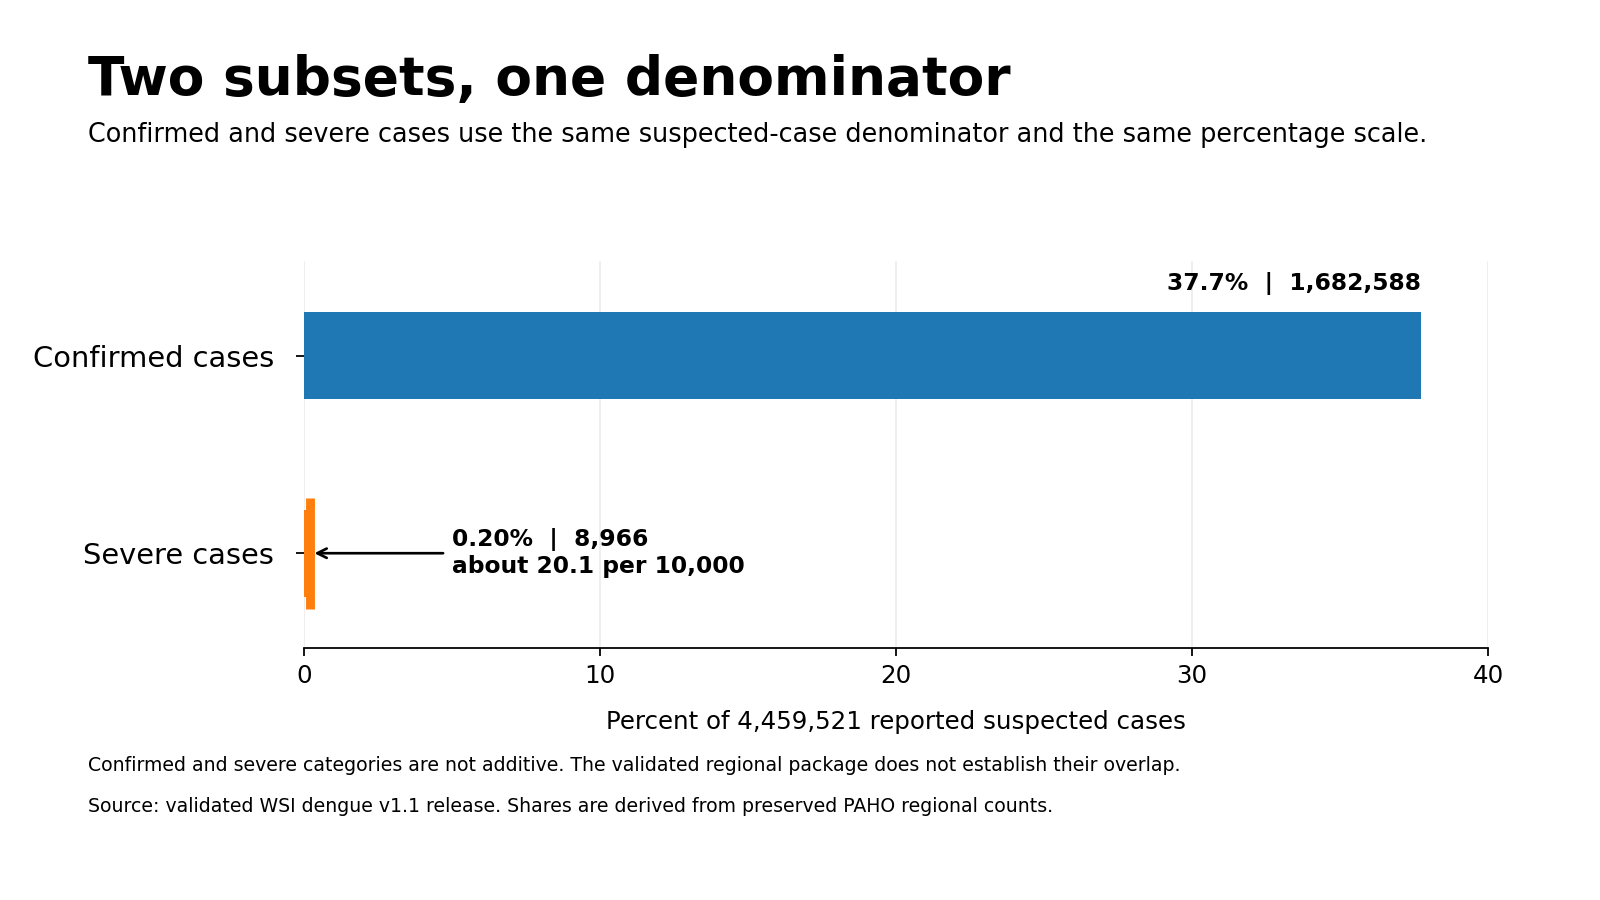
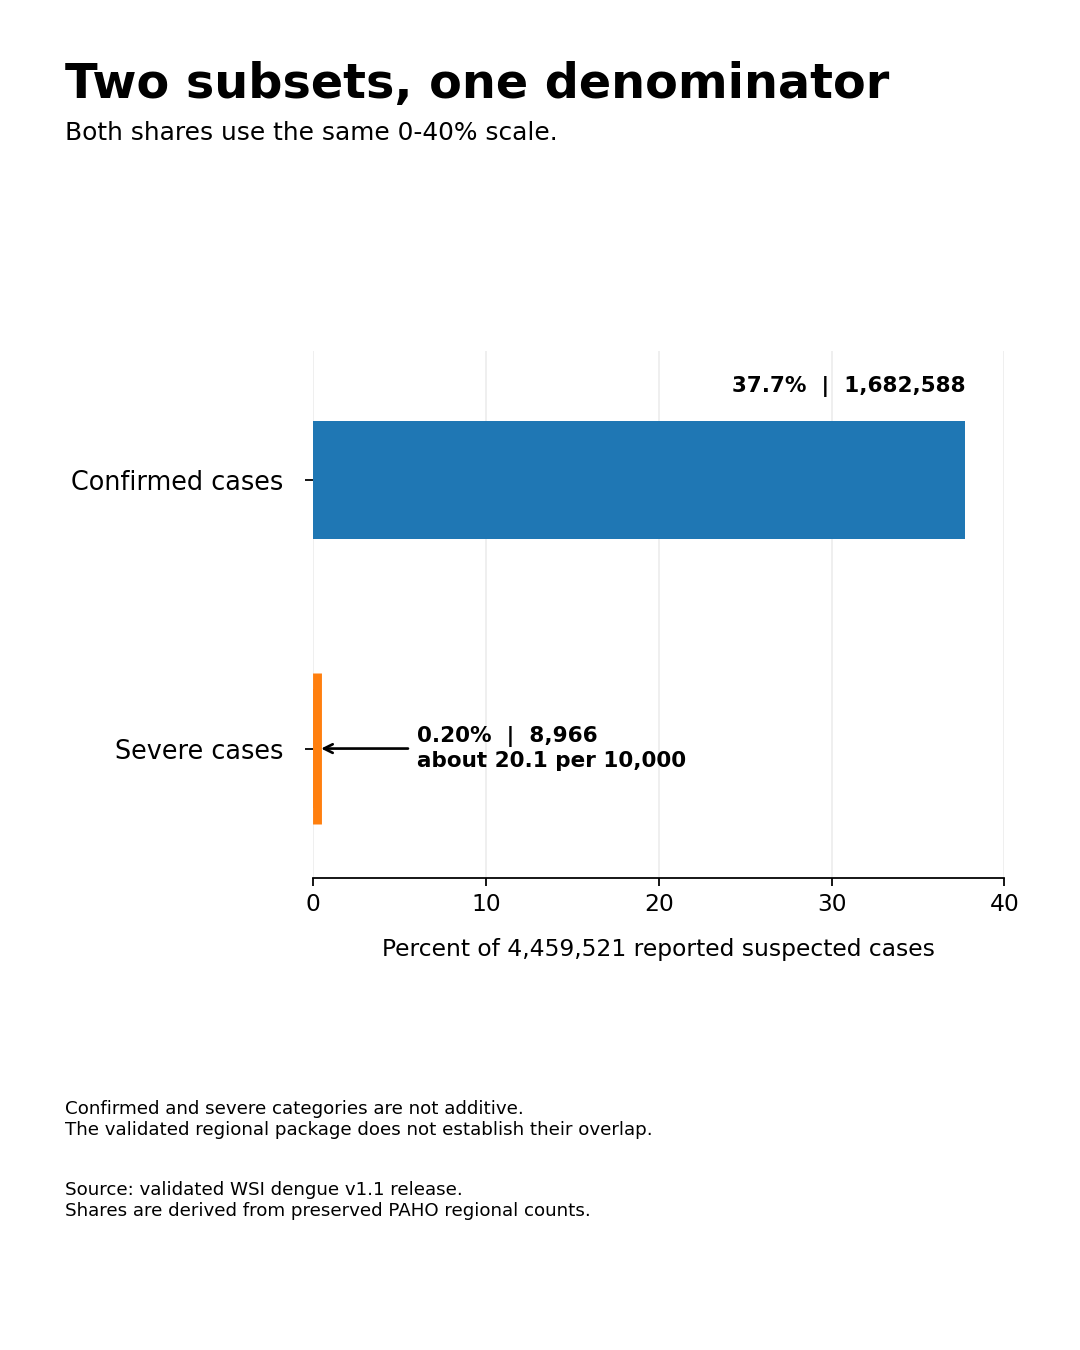
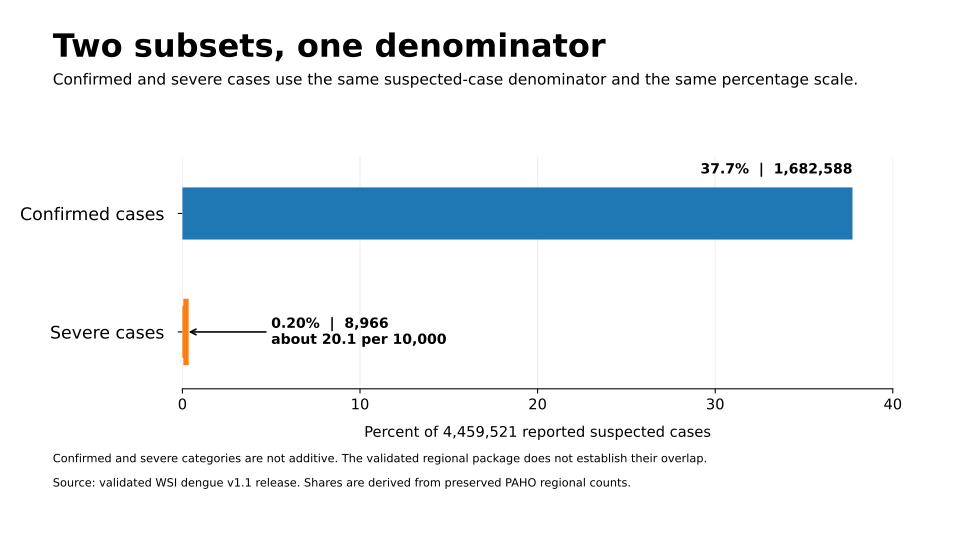
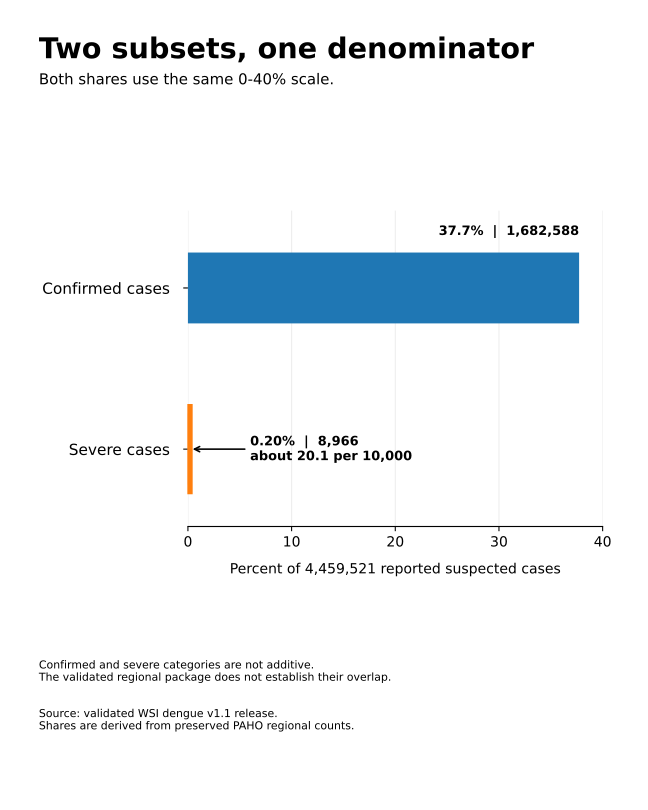
Suspected cases are surveillance reports that meet the source reporting definition. They are not an estimate of every dengue infection, and the validated WSI package does not adjust for under-ascertainment. Confirmed cases are a subset of suspected reports. Severe cases are also a subset of reported suspected cases. They should not be added to the suspected total.
In the 2025 regional controls, confirmed cases were about 37.7% of suspected cases. Severe cases were about 0.20%, or about 20 severe cases per 10,000 suspected reports. Both shares are shown on the same percentage scale below.

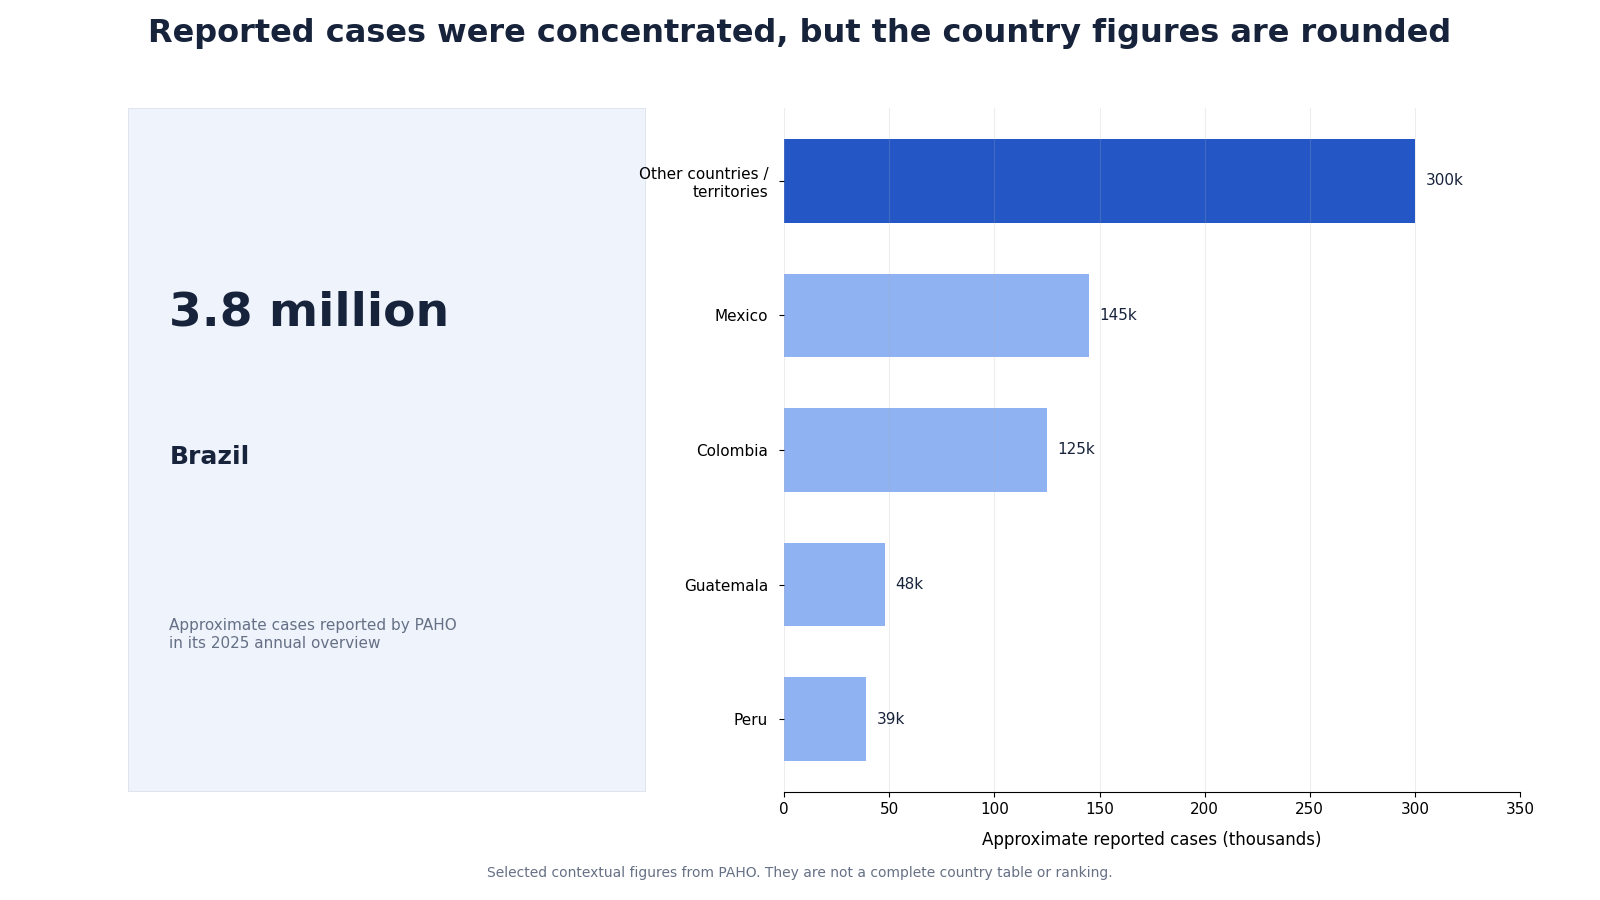
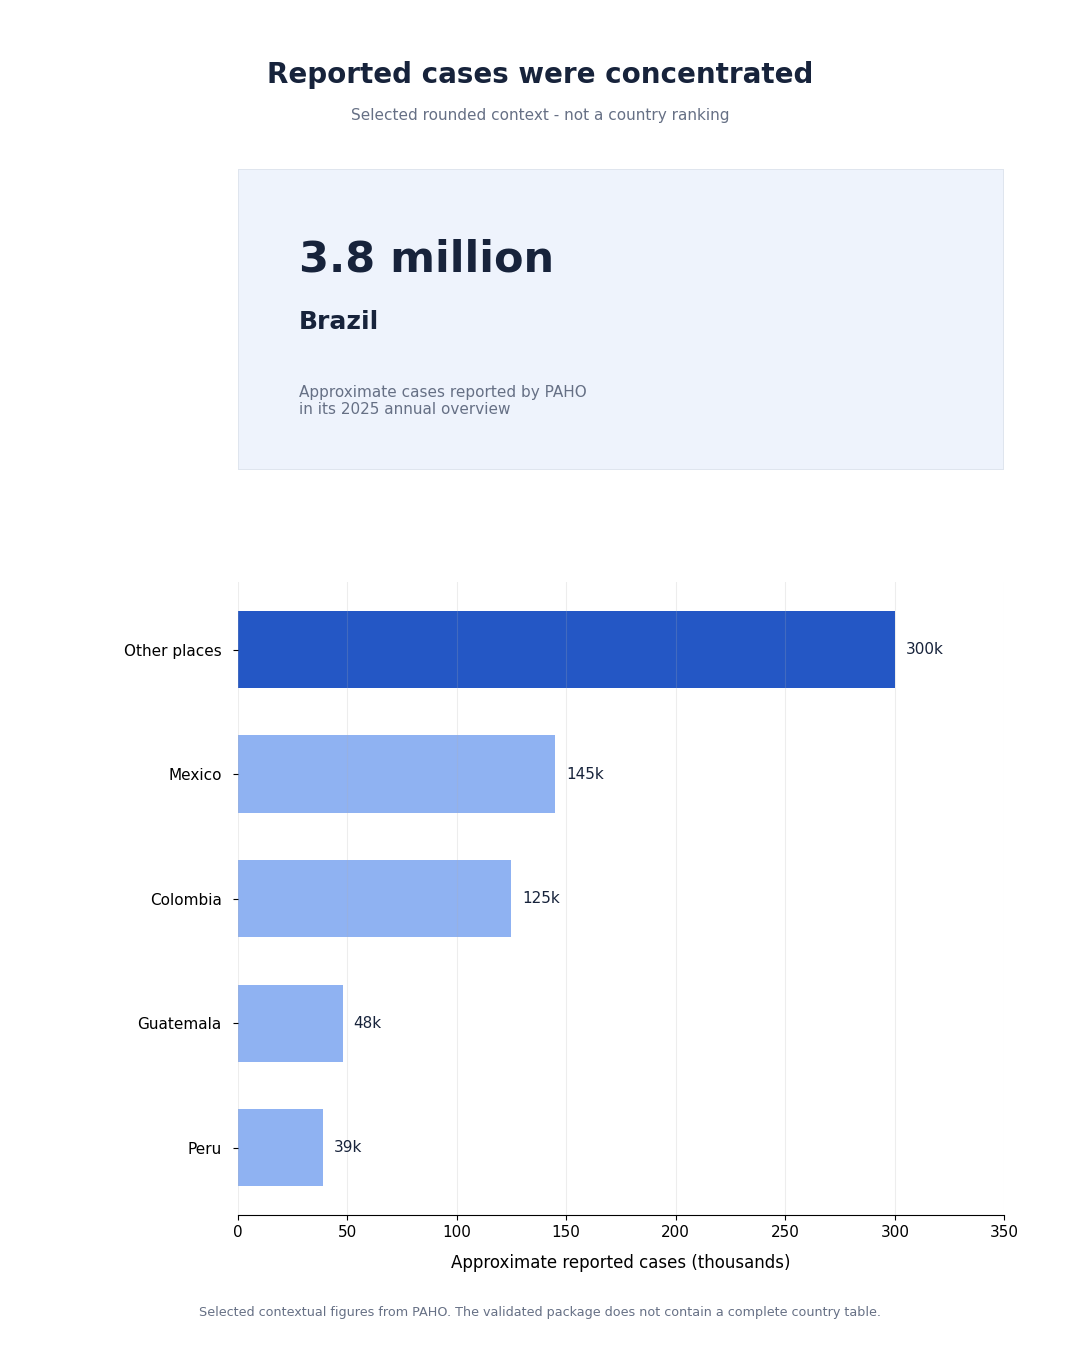
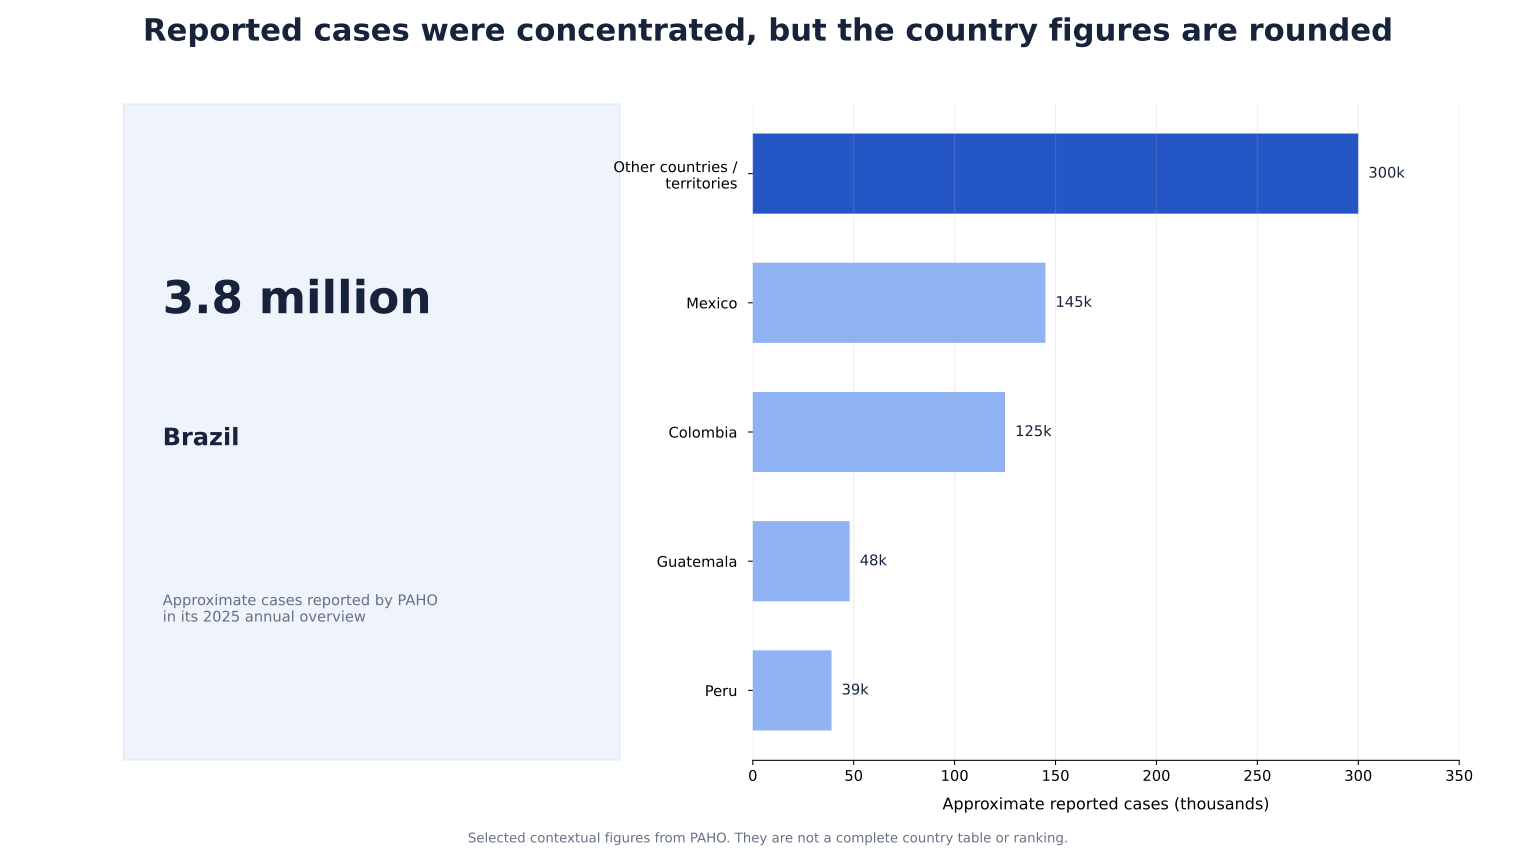
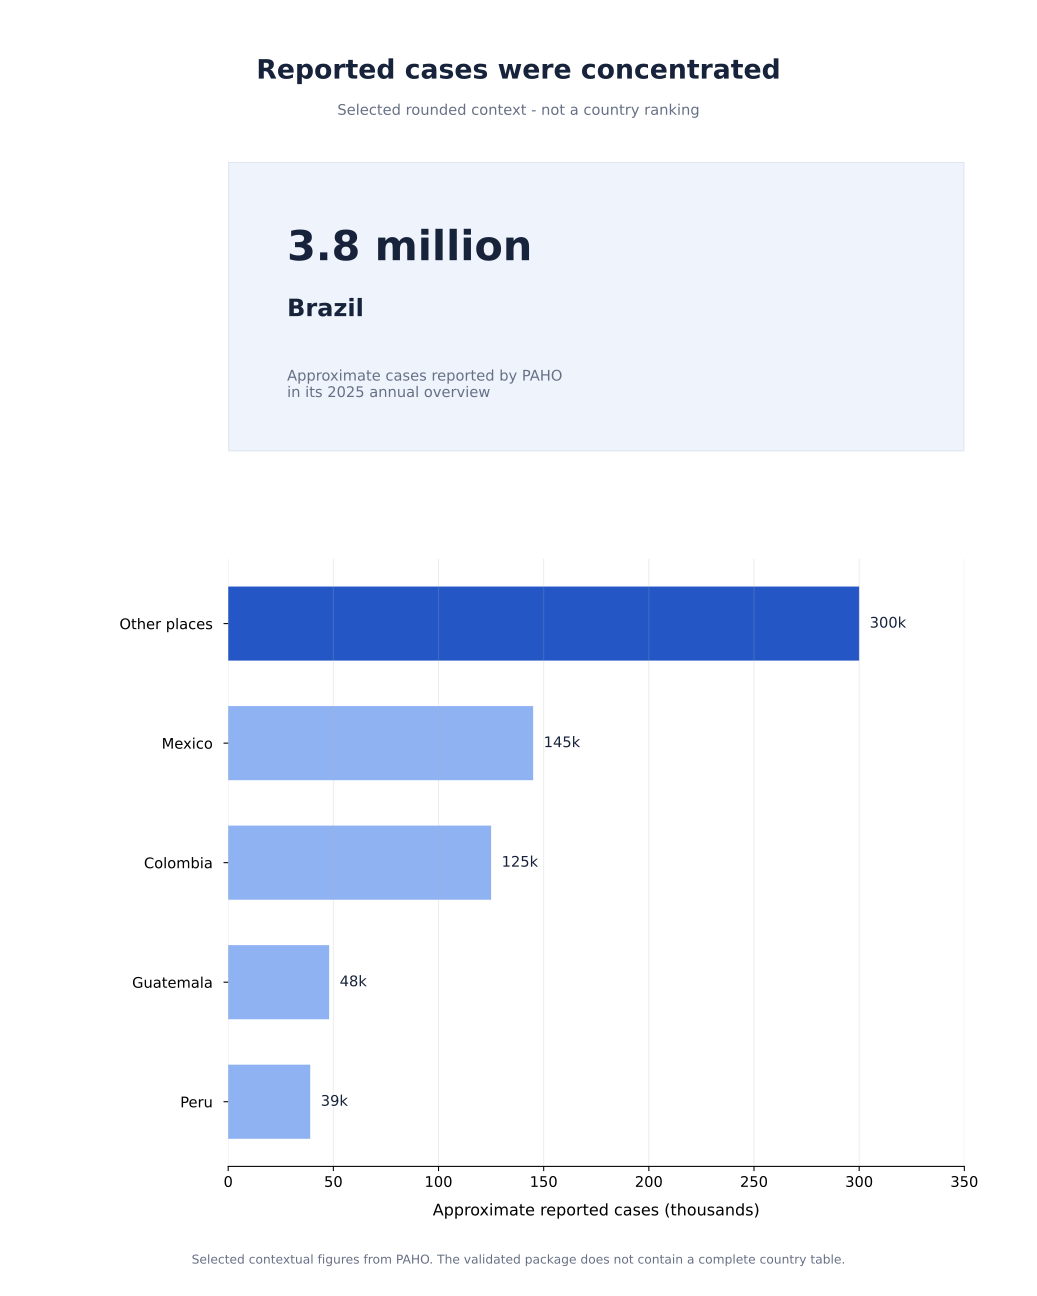
PAHO's annual overview reported approximately 3.8 million cases in Brazil, 145,000 in Mexico, 125,000 in Colombia, 48,000 in Guatemala, 39,000 in Peru, and about 300,000 across other countries and territories. The values are rounded contextual highlights. The validated package does not contain a canonical 2025 country table or a confirmed list of the 46 reporting members, so WSI does not publish a country ranking.

Deaths are not another case category. They are outcomes reported separately from nonfatal cases. PAHO's regional case-fatality rate was 0.05%. The validated controls reproduce that rounded result: 2,207 reported deaths divided by 4,459,521 reported suspected cases equals 0.04949%.
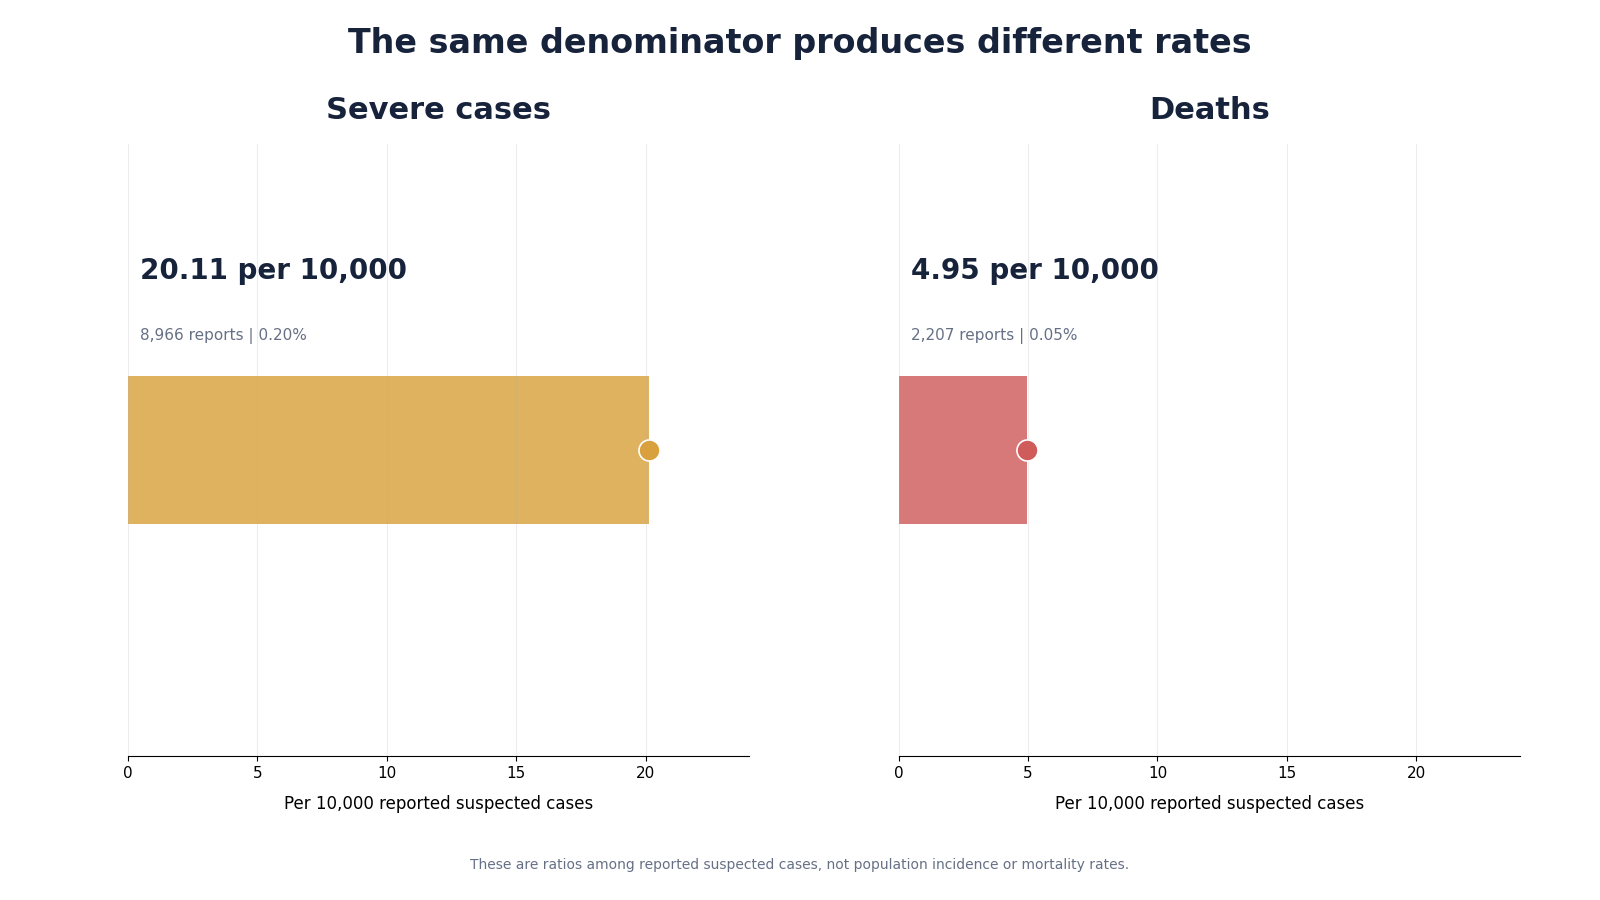
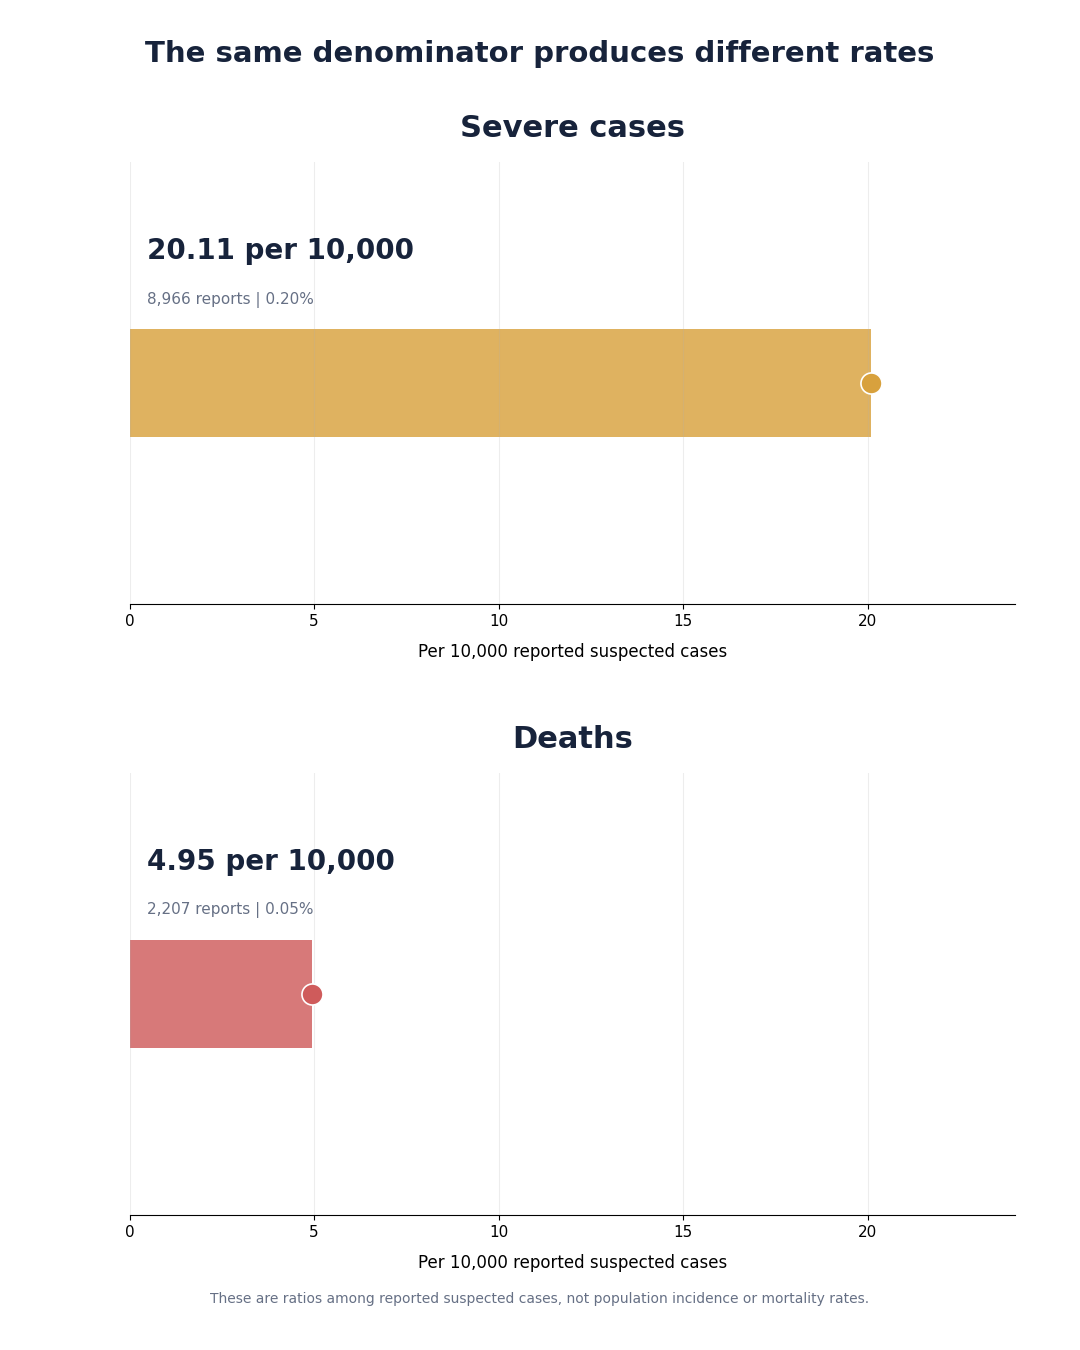
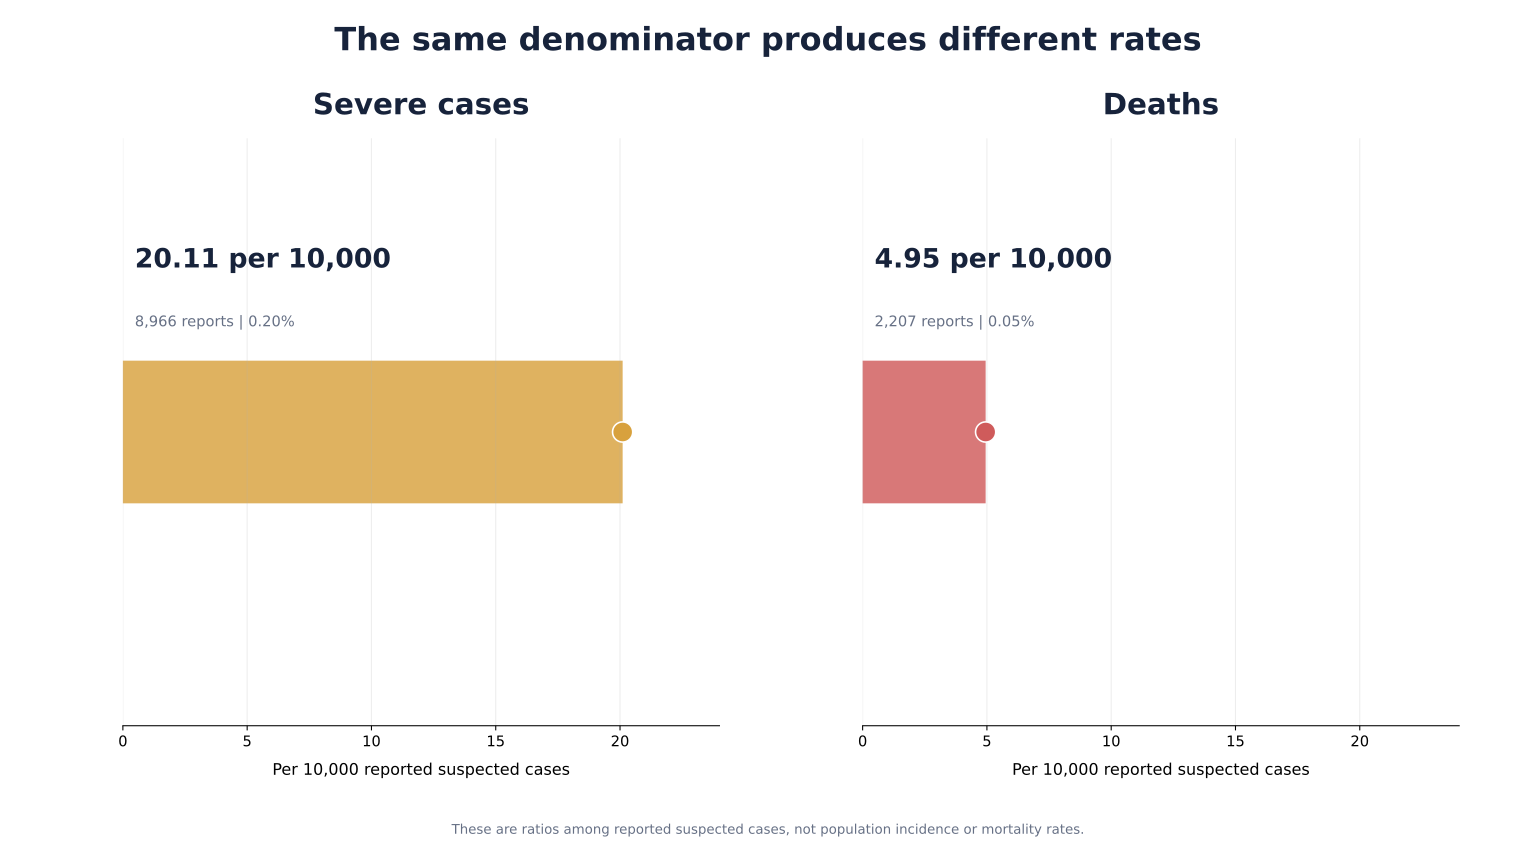
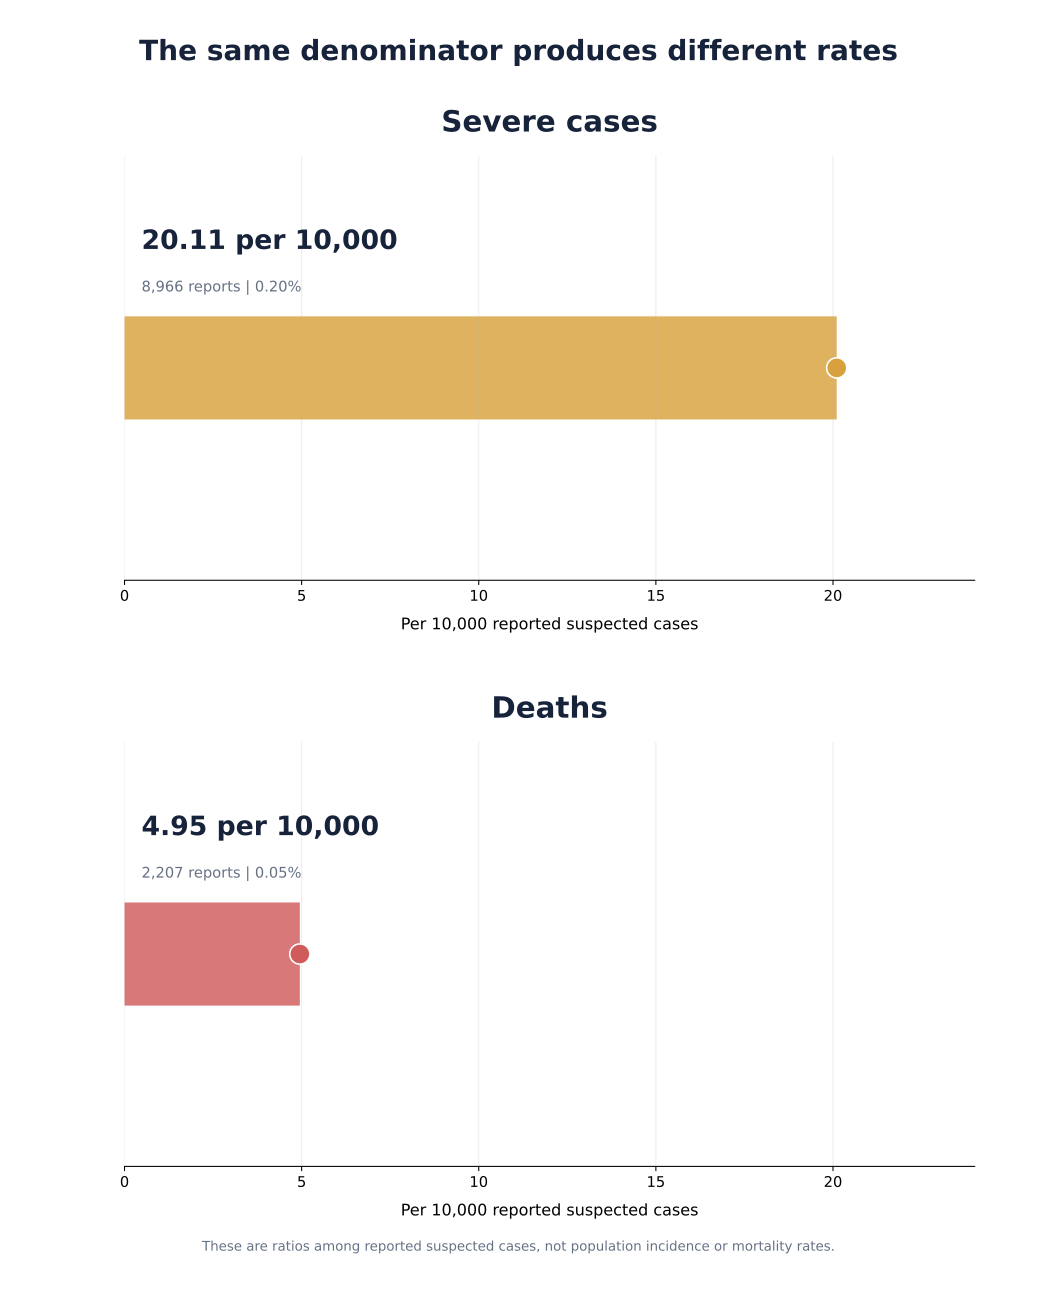
The severe-case share asks a different question. It is 8,966 severe cases divided by the same suspected-case denominator, or about 20.1 per 10,000. The death rate shown here is about 4.95 per 10,000 reported suspected cases. These are surveillance ratios, not population incidence or mortality rates.

The regional controls show the scale and composition of reported dengue surveillance in 2025. They support a clear distinction among reported cases, confirmed cases, severe cases, deaths, and ratios derived from those counts. They do not estimate total infections, establish population incidence, or support a complete country ranking.
PAHO reported that cases fell by 66% and deaths by 74% from the record 2024 year. Those changes are useful context, but the current Data Story remains focused on the meaning of the 2025 measures rather than building a new trend analysis.
What these measures mean
USU Research
The approved dengue pilot applies duration and intensity mappings to non-severe and severe episode counts. Its central estimate is approximately 45.4 million USU, with a deterministic mapping range of 18.2-95.5 million USU. Those model outputs are not used to combine or rank the source measures in this Data Story.
Downloads
Wide and mobile PNGs, font-safe SVGs, and CSV files.
Download ZIPDefinitions, arithmetic, source boundaries, and registry additions.
Open PDFWSI Suffering Measures Registry v1.1.0.
Download ZIPAll source values come from the validated dengue v1.1 package already used by WSI. No new dengue data were acquired.