Drinking water · Data story
A water source is not the same as a safe, reliable supply
Access, availability and quality tell different stories. So do coverage percentages and the number of people left without a service.
In 2024, about 2.1 billion people lacked safely managed household drinking water. That does not mean all of them had no water source. The headline combines very different levels of service.
Global coverage improved after 2015, and the total number without safely managed service fell. But the urban headcount moved in the opposite direction. Four visuals explain what changed — and what these estimates can actually tell us.
Source: WHO/UNICEF JMP household estimates. Headcounts and changes calculated by WSI; approximate, not individual histories.
01 · The service ladder
One access gap, four different service levels
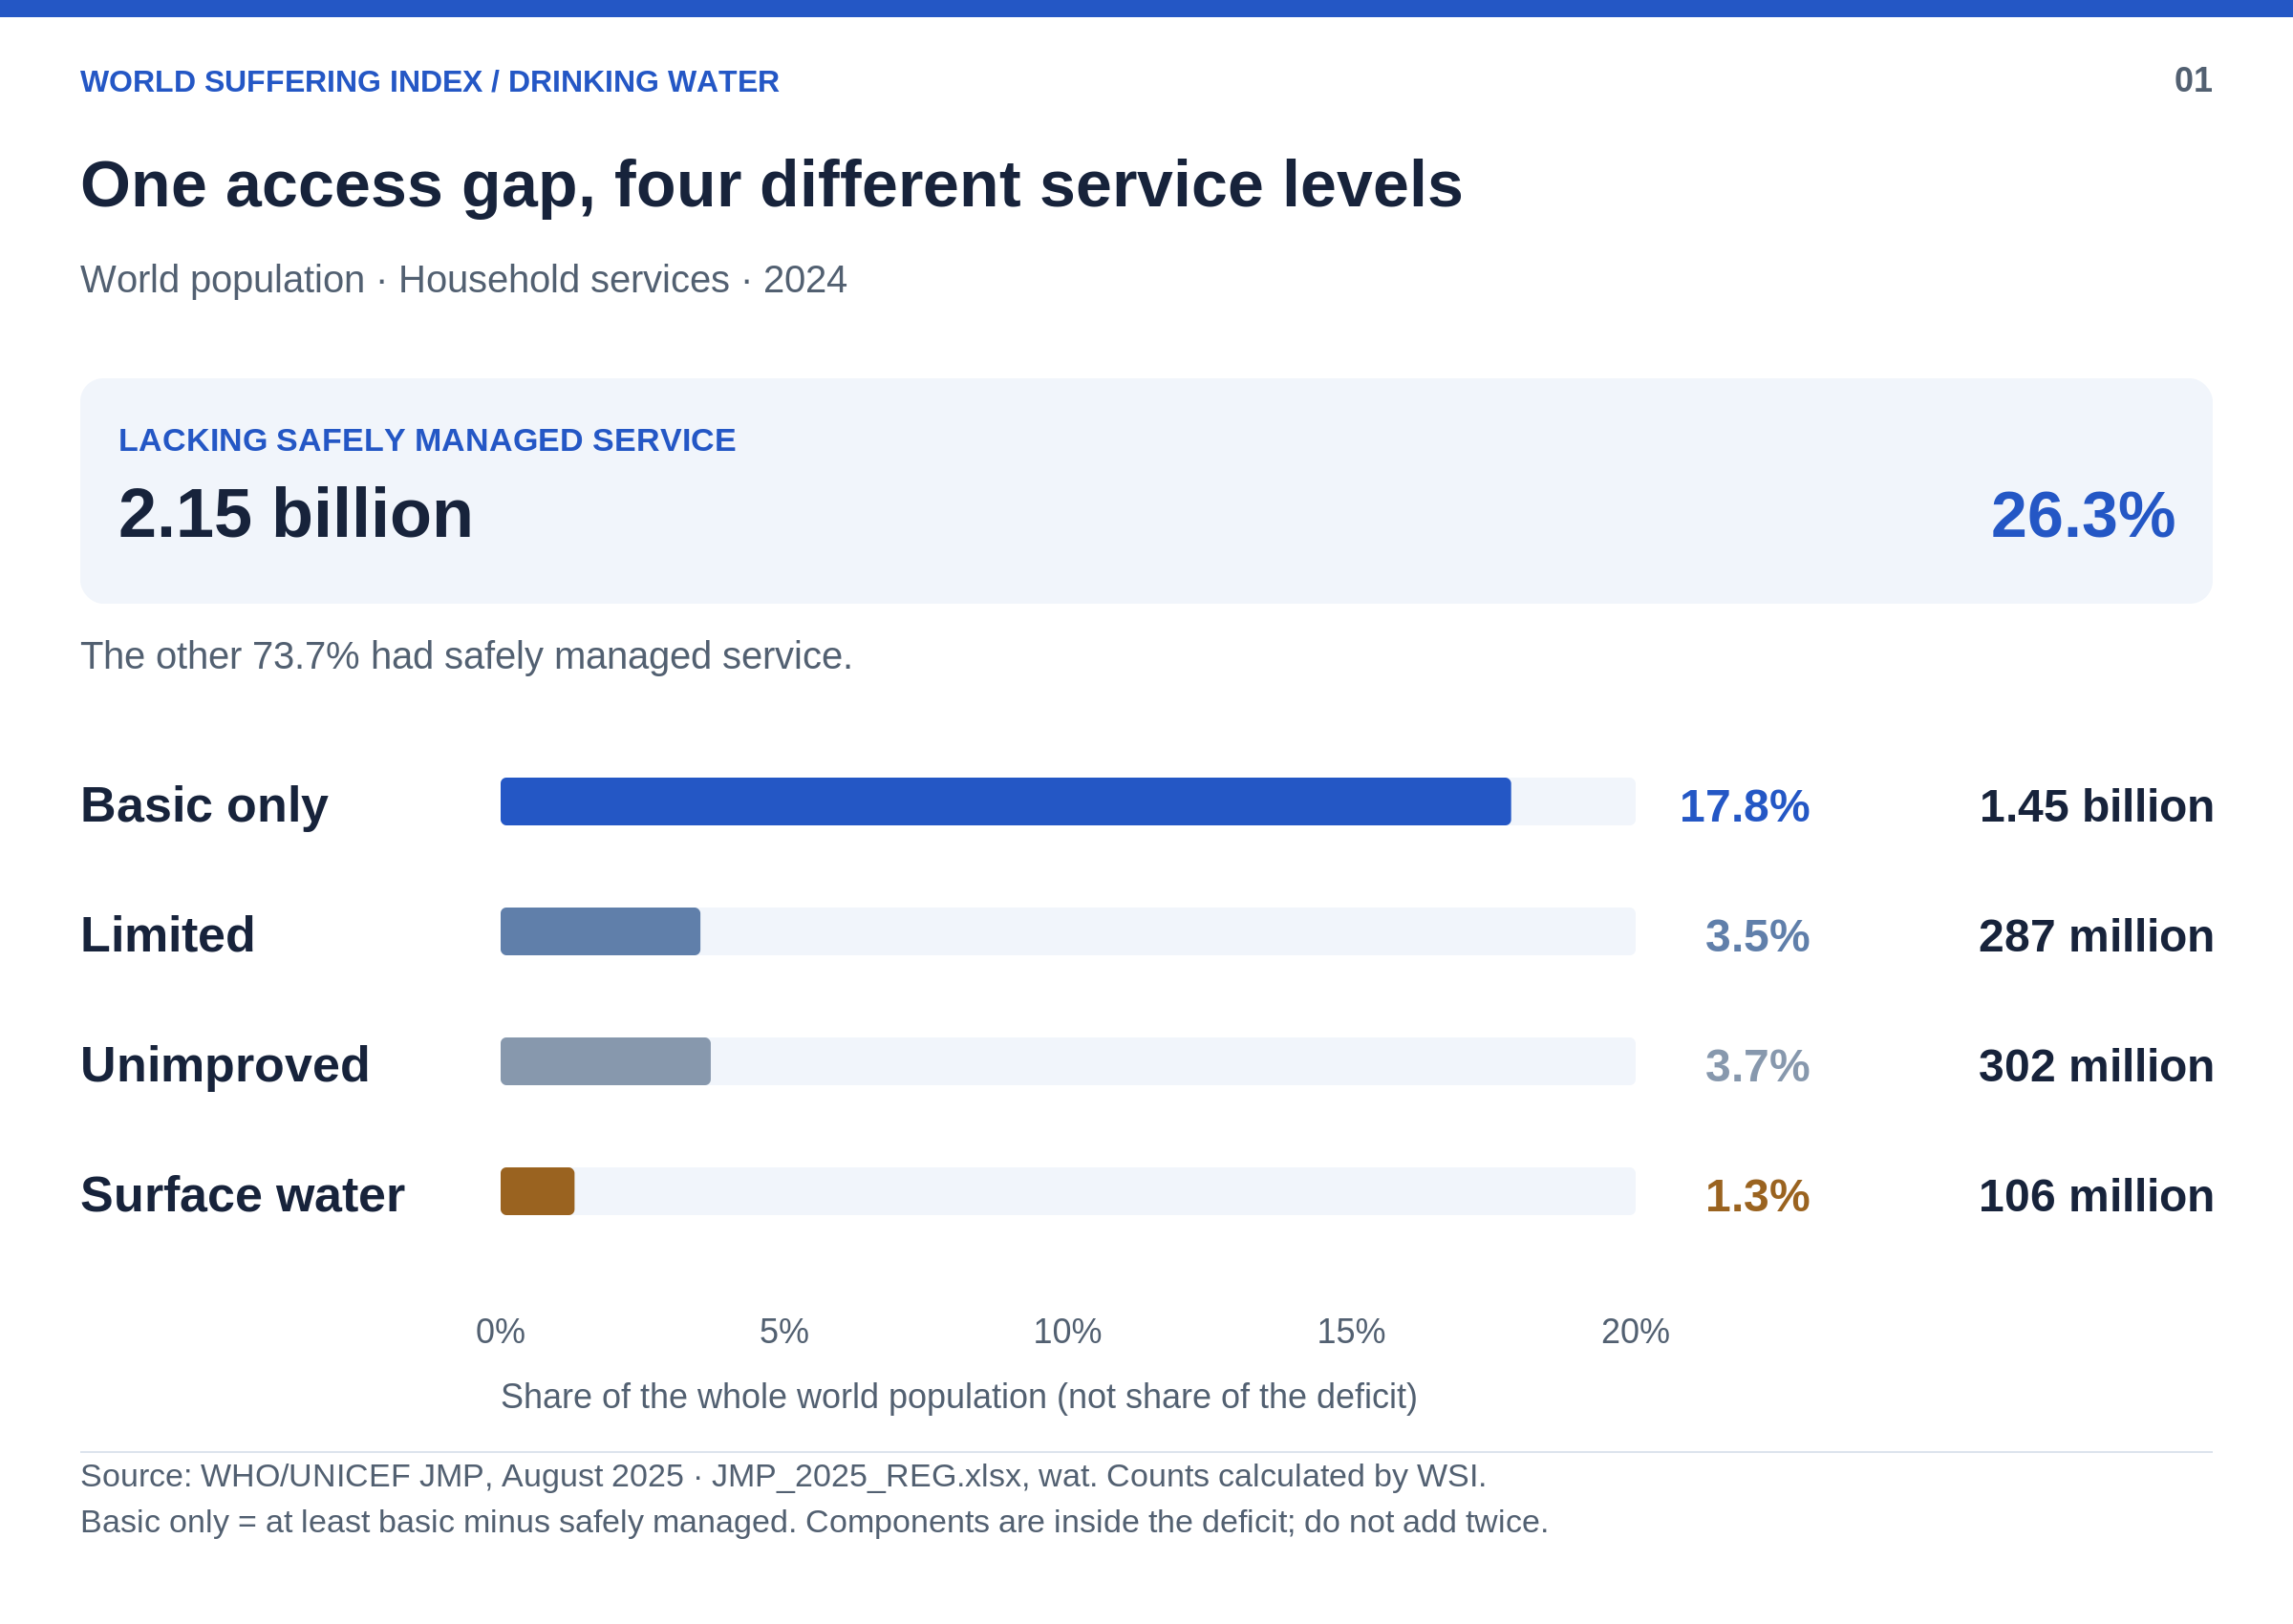
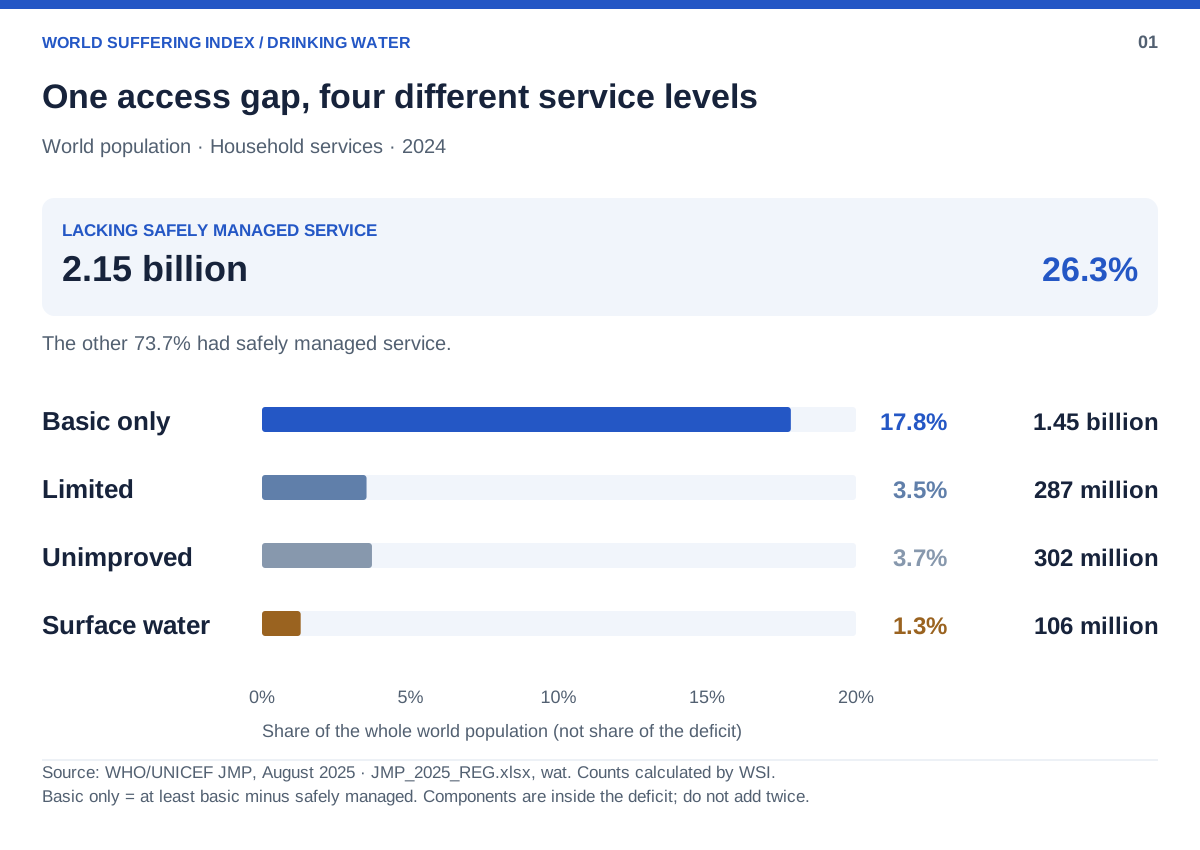
Most of the global gap sits above the lowest service levels. About 1.45 billion people had basic service only. They used an improved source with collection taking no more than 30 minutes round trip, including queuing, but were not classified as having safely managed service.
The same headline also includes about 287 million people with limited service, 302 million using unimproved sources and 106 million using surface water directly. Those situations are not interchangeable.

The four bars sit inside the deficit total. “At least basic” already includes safely managed; “basic only” subtracts it.
Use this finding
In 2024, about 2.1 billion people globally lacked safely managed household drinking water. About 1.45 billion had basic service only; 106 million used surface water directly.
Period: 2024
Population: World population represented in JMP household estimates
Official source: WHO/UNICEF JMP, August 2025
The headline includes basic-only, limited, unimproved and surface-water services. It is not a count of people with no water source or confirmed contaminated water. Do not add the components to their total.
02 · What the standard requires
An improved source is only the starting point
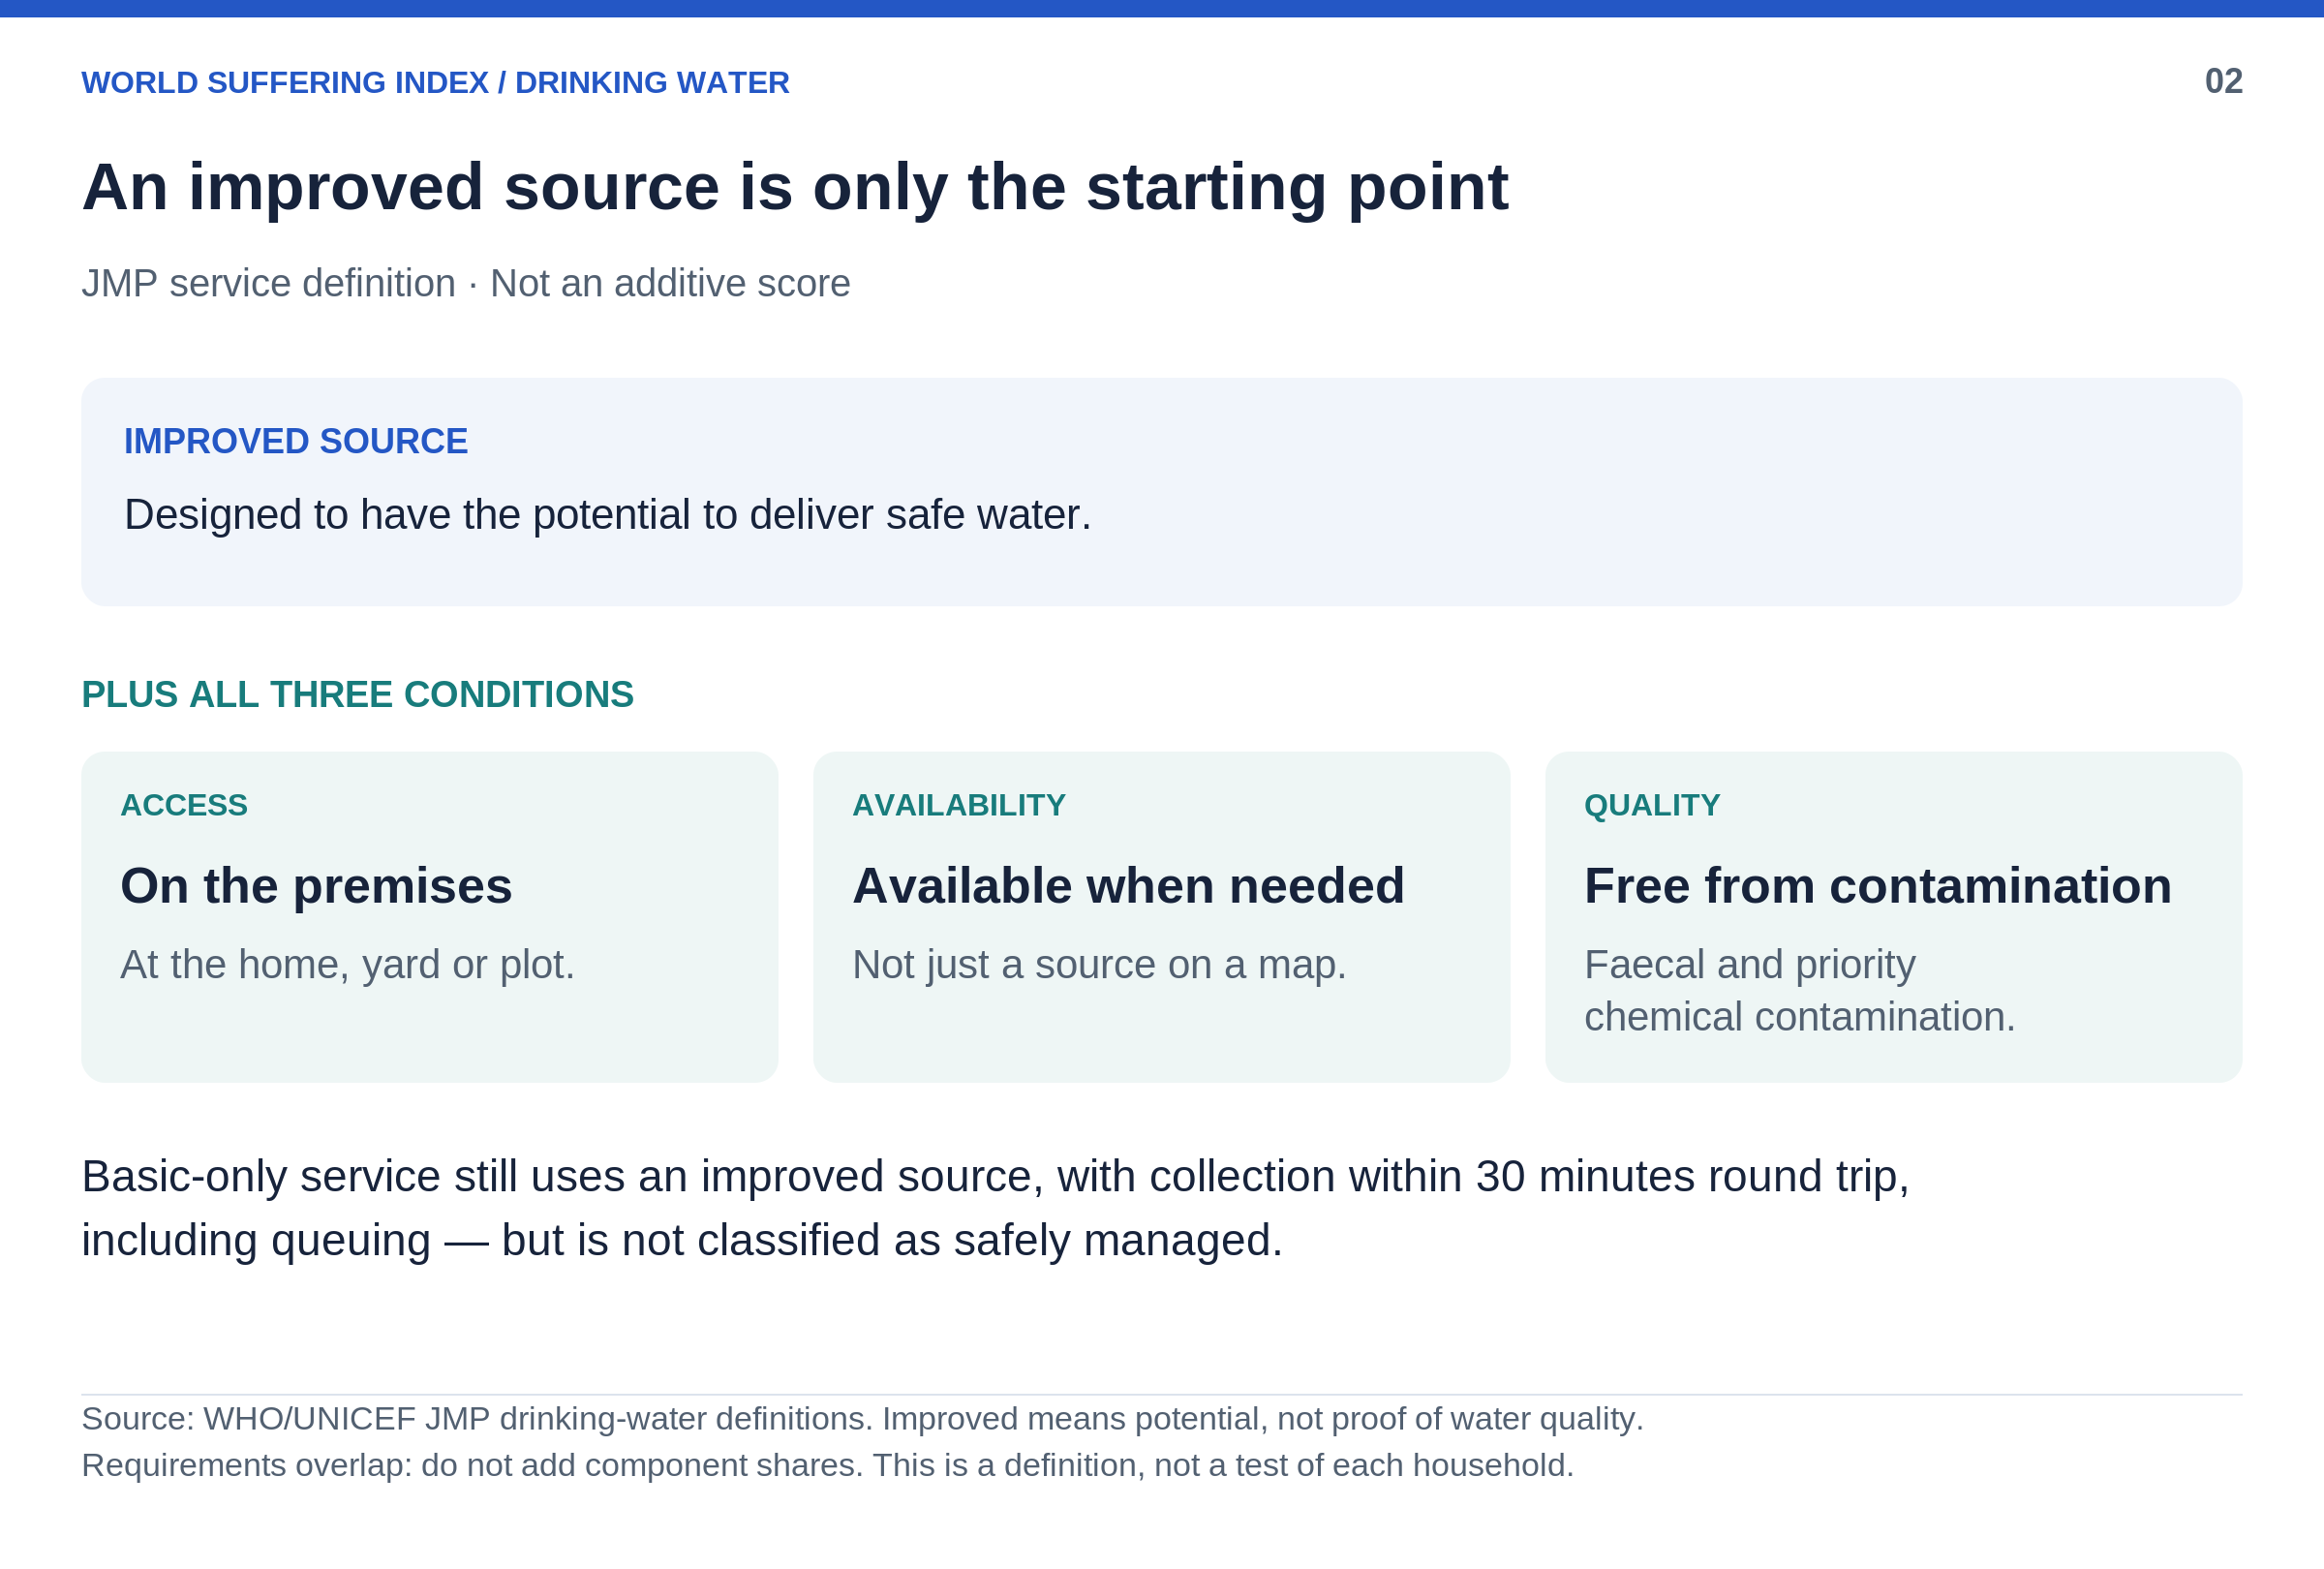
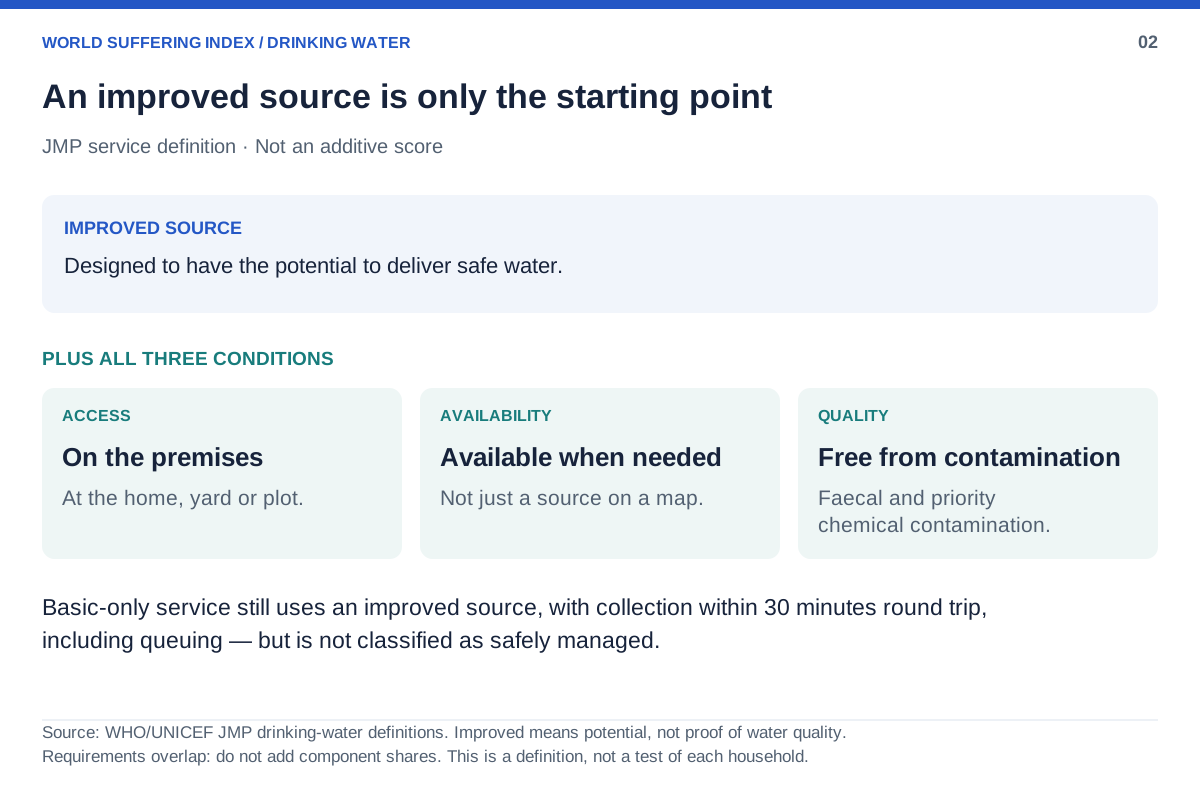
An “improved” source is designed to have the potential to supply safe water. The safely managed standard goes further: the source must be on the premises, available when needed and free from specified contamination.
Failing to meet the safely managed standard is therefore not the same as having no source or having confirmed contaminated water. A short collection trip alone cannot establish availability and quality.

An improved source plus three required conditions — not three separate populations or an additive quality score.
Use this finding
A safely managed drinking-water service needs an improved source on the premises, available when needed, and free from faecal and priority chemical contamination.
Period: JMP service definition; 2025 release context
Population: World population represented in JMP household estimates
Official source: WHO/UNICEF JMP, August 2025
These conditions overlap; they are not separate groups to add. The diagram describes the standard, not a claim that every household has been individually tested.
03 · Progress since 2015
Global coverage rose; the access gap narrowed
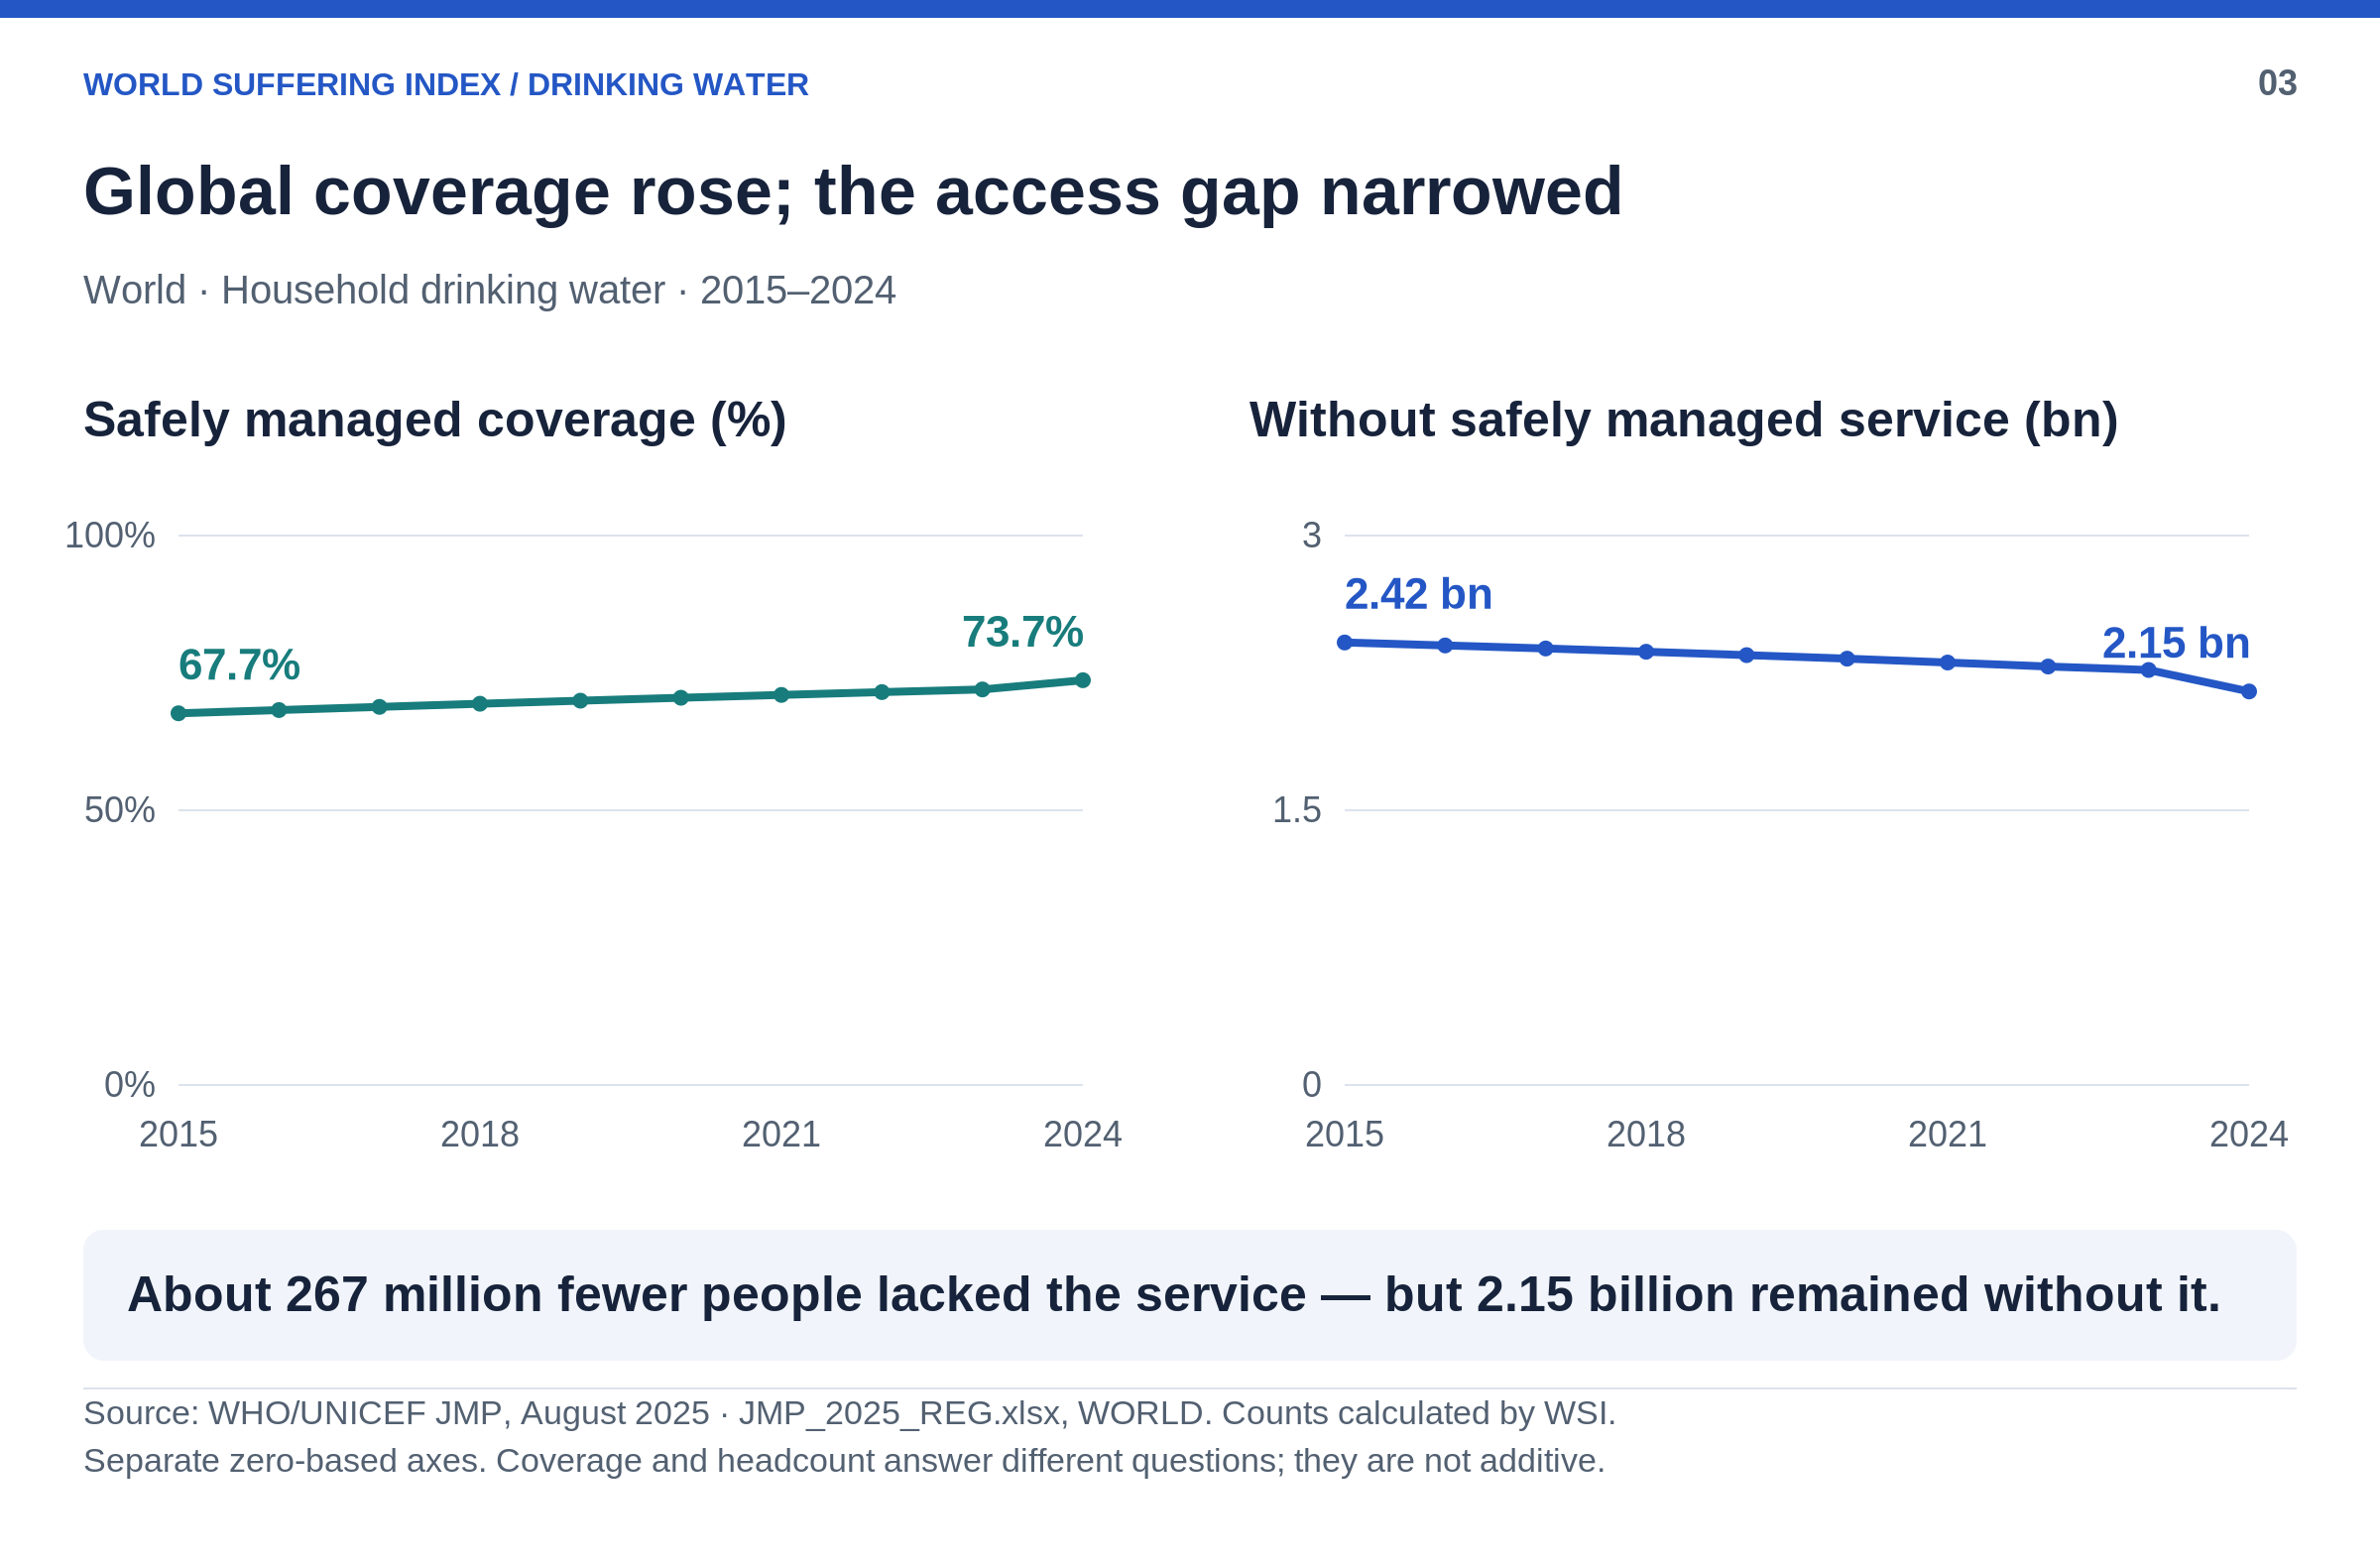
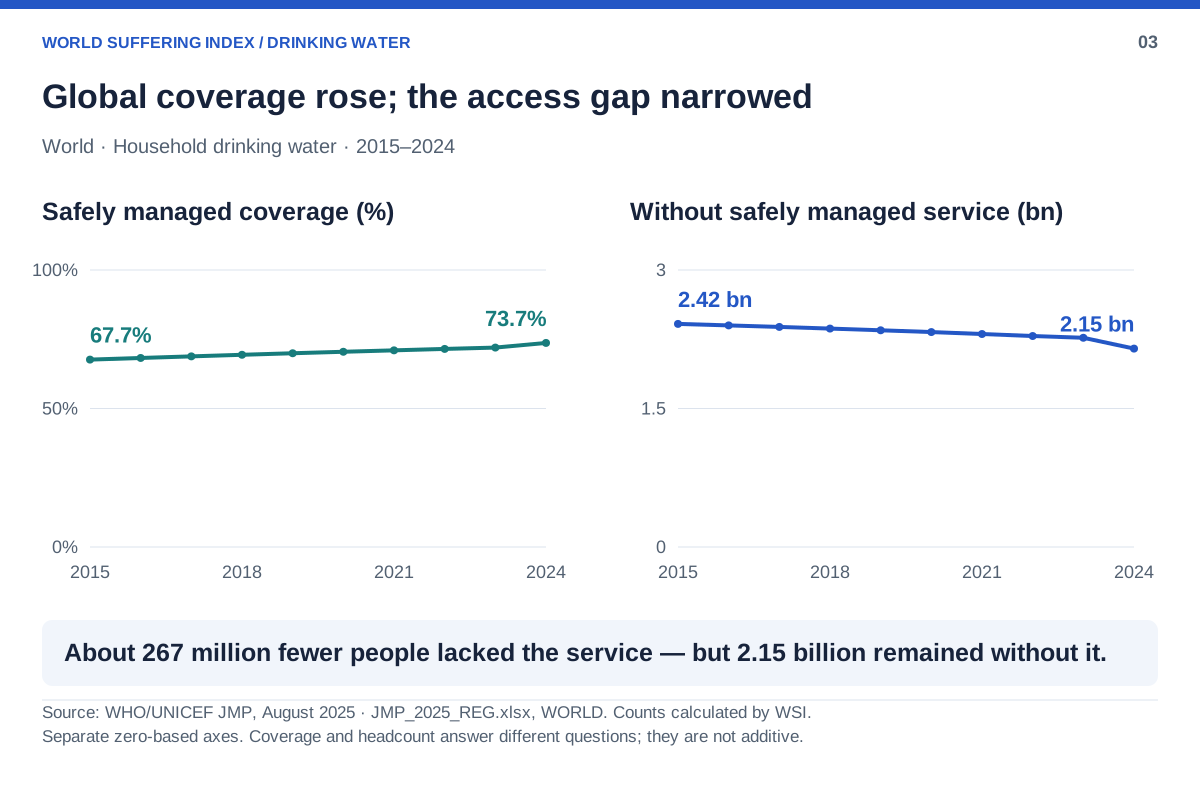
Between 2015 and 2024, safely managed coverage rose from 67.7% to 73.7% — an increase of 6.0 percentage points.
Over the same period, the estimated population without the service fell from 2.42 billion to 2.15 billion, or about 267 million fewer people. This is progress in two different measures, not two quantities to combine.

The reference year and population travel with the number. Percentages and headcounts have different units.
Use this finding
Between 2015 and 2024, global safely managed drinking-water coverage rose from 67.7% to 73.7%. The estimated population without the service fell from 2.42 billion to 2.15 billion.
Period: 2015–2024
Population: World population represented in JMP household estimates
Official source: WHO/UNICEF JMP, August 2025
Coverage and headcount describe the same population from different perspectives. Do not add them or add annual estimates to count unique people.
04 · Rural and urban trajectories
The global gap shrank — the urban gap grew
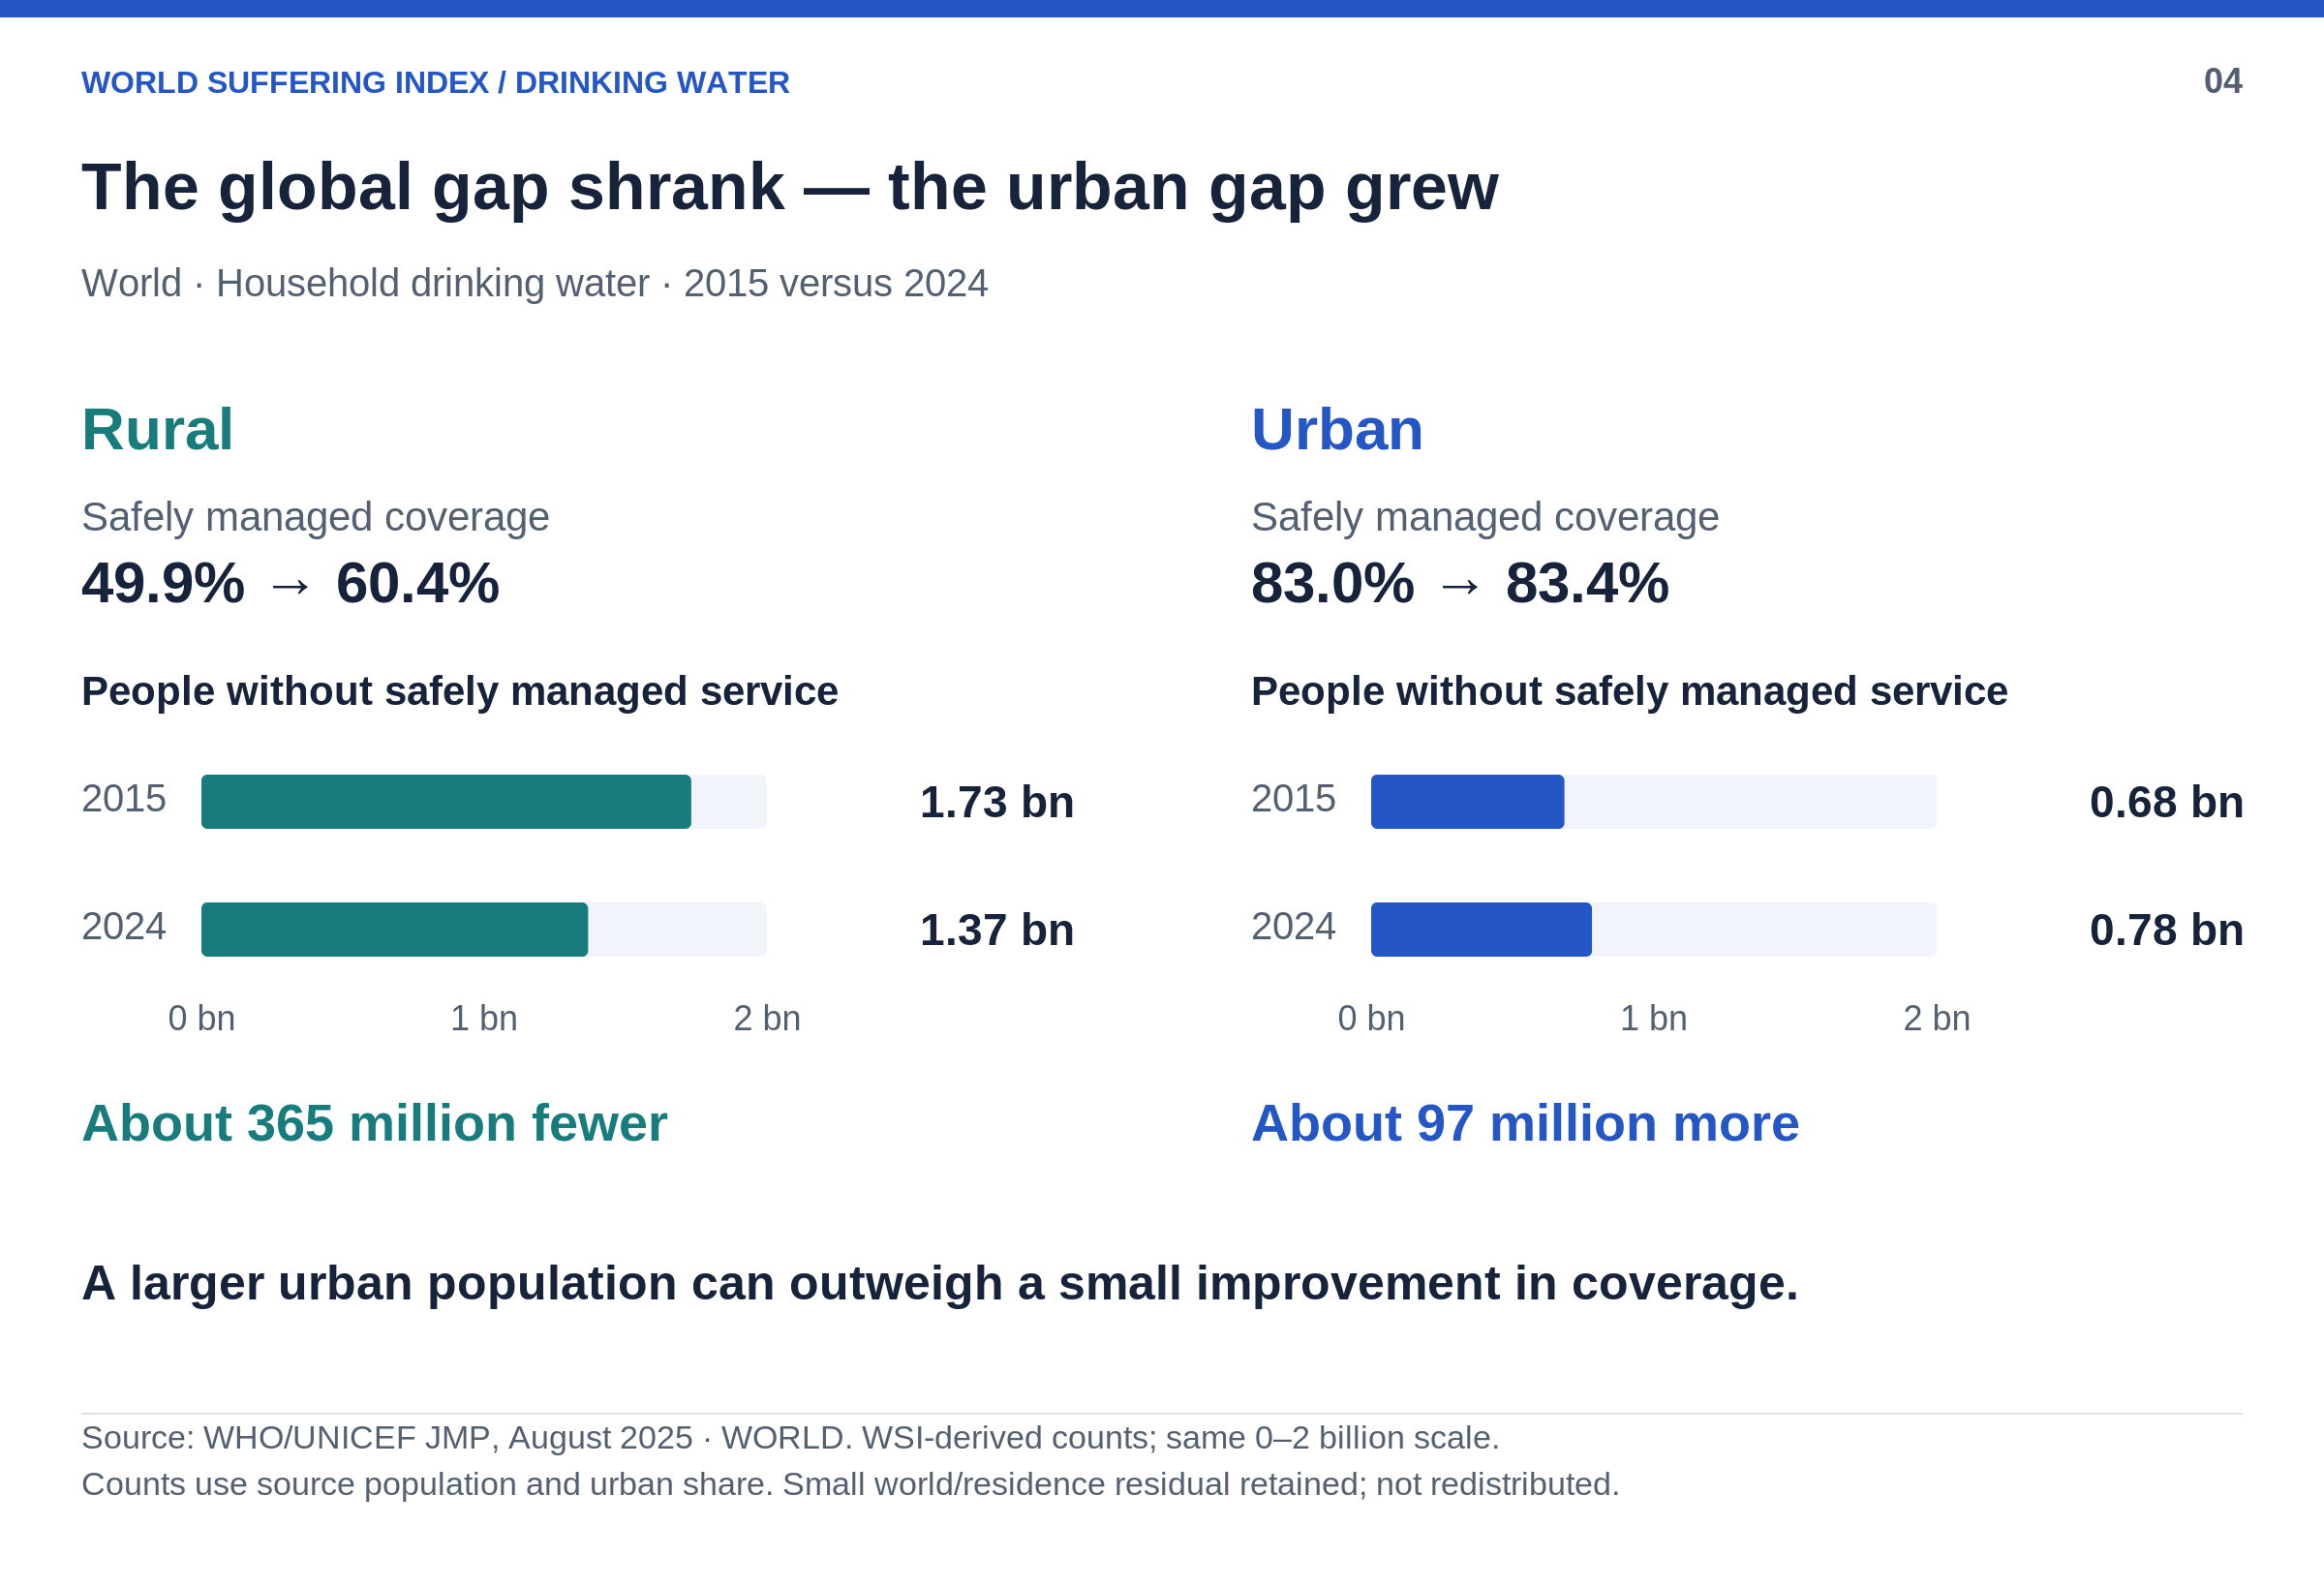
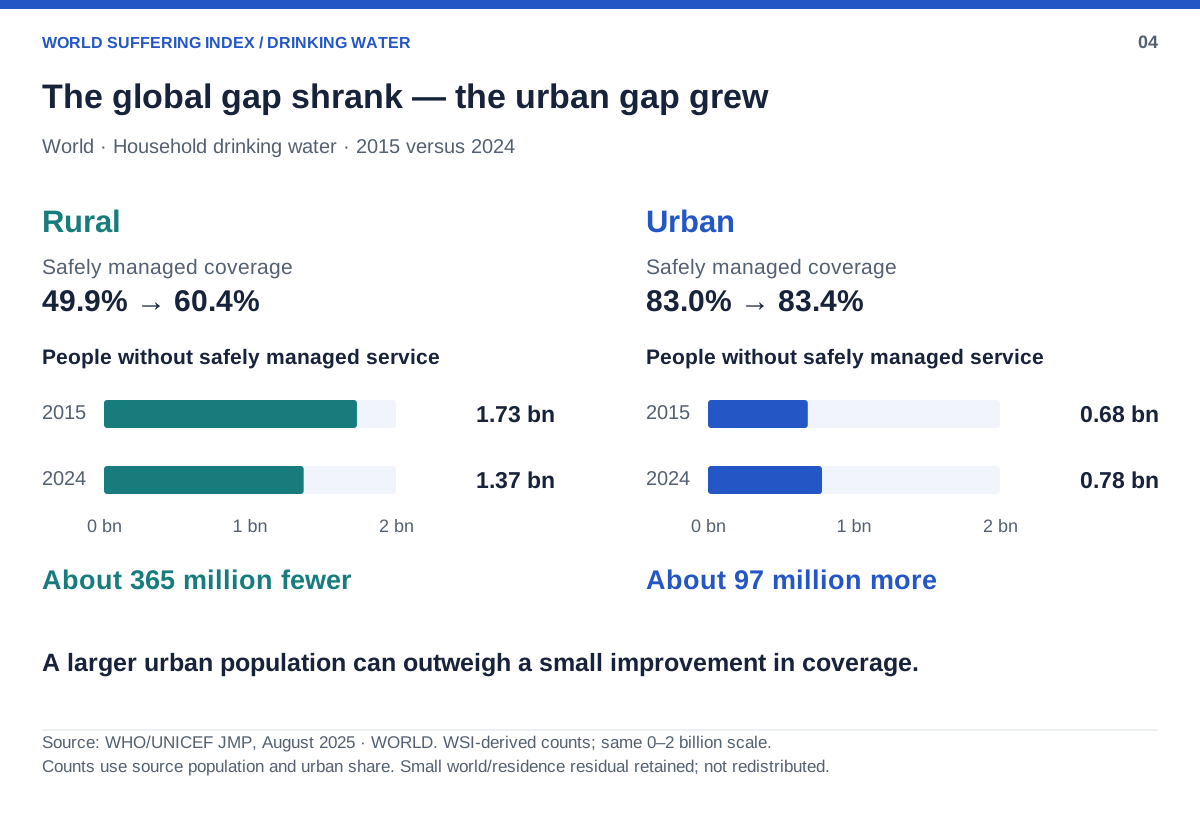
Rural safely managed coverage rose from 49.9% to 60.4%. The estimated rural population without the service fell from 1.73 billion to 1.37 billion.
Urban coverage changed much less: 83.0% to 83.4%. Yet the urban population without the service rose from 684 million to 781 million. In the source population estimates, the urban population grew from 4.01 billion to 4.71 billion. A smaller unserved share of a larger population can still mean more people without a service.
This arithmetic does not identify why the urban population changed, or measure the effects of any particular policy. It does not track whether the same individuals gained or lost access.

Rural and urban counts are WSI estimates using the published world population and urban share. Small reconciliation residuals are retained, not forced away.
Use this finding
Between 2015 and 2024, the estimated urban population lacking safely managed drinking water rose from 684 million to 781 million, even as urban coverage increased slightly from 83.0% to 83.4%.
Period: 2015–2024
Population: World population represented in JMP household estimates; rural and urban groups separately
Official source: WHO/UNICEF JMP, August 2025
Headcounts are WSI calculations using JMP population and residence shares. The change is not a count of people newly deprived, migration, or individual transitions; small aggregate residuals remain.
Reading the evidence
Service access is not a suffering score
These estimates describe household drinking-water conditions, not illness, deaths or the intensity of someone’s suffering. They are not converted into Universal Suffering Units and are not added to the mortality figures elsewhere on WSI.
The source table supplies point estimates, not uncertainty intervals. Missing estimates are not treated as zero. The source definitions and estimation process matter as much as the headline.
Use the data
Charts, tables and citations
Each “Use this finding” panel keeps the period, population, source and interpretation attached to the takeaway. Citations can be copied or selected manually.
Four figures in wide and mobile PNG/SVG formats, chart-data CSVs, extended descriptions, and source notes. Underlying estimates remain attributable to WHO/UNICEF JMP.