Source lockedVisual Brief v1.1Deployment package ready
Child and maternal mortality
A falling rate can still mean millions of deaths
Child and maternal mortality have declined, but counts, age-specific probabilities, a live-birth ratio, shares, lifetime risk, and annual reduction statistics answer different questions.
Main takeaway. Progress is real, but it must be read through measures with explicit periods, populations, denominators, subsets, and uncertainty. This brief creates no combined child-plus-maternal total.
Source lock closed; publication package validated
All seven exact official source binaries and the approved v2.6.1 website baseline were captured, validated, inspected, and hashed. Source-native values were reconciled before release.
Reproducibility controls
- UN IGME child values were checked against four source-native XLSX files; child uncertainty intervals are 90%.
- MMEIG maternal values were checked against the official XLSX and complete WHO data archive; maternal uncertainty intervals are 80%.
- The WHO indicator export independently matched 193 of 195 2023 MMEIG entities; Palestine and Puerto Rico are absent from that indicator export.
- The approved website baseline matched SHA-256 1df795fb9a819e82483c147888115268987af4060805d17d364883dff140b13e.
- No child-plus-maternal total, country ranking, causal attribution, or mortality-to-USU conversion is published.
01 · Measures
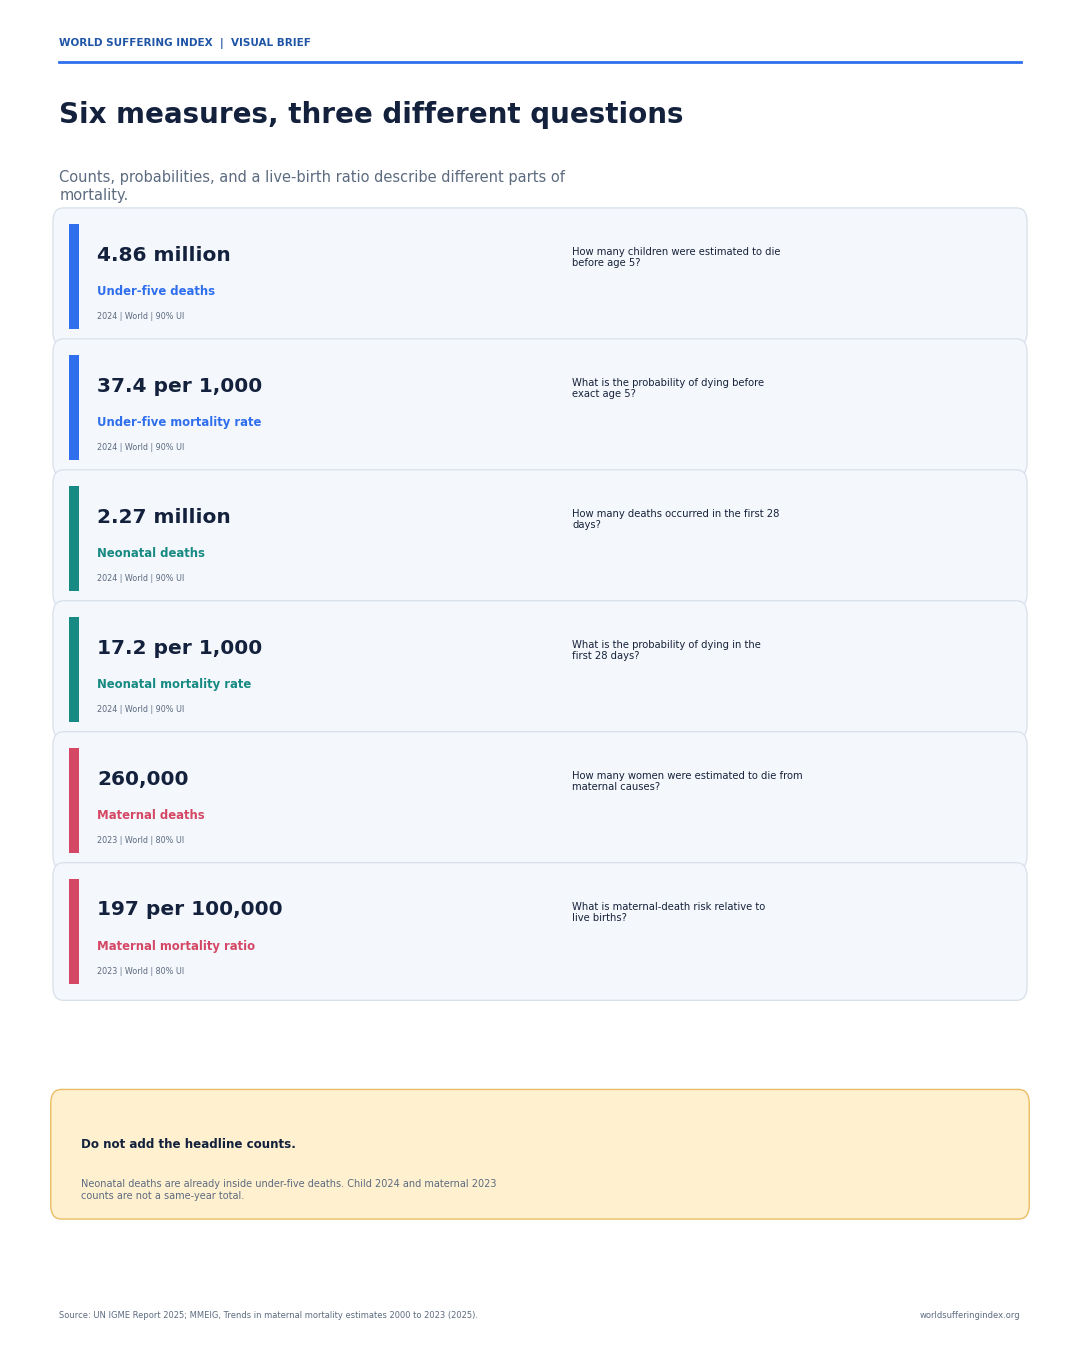
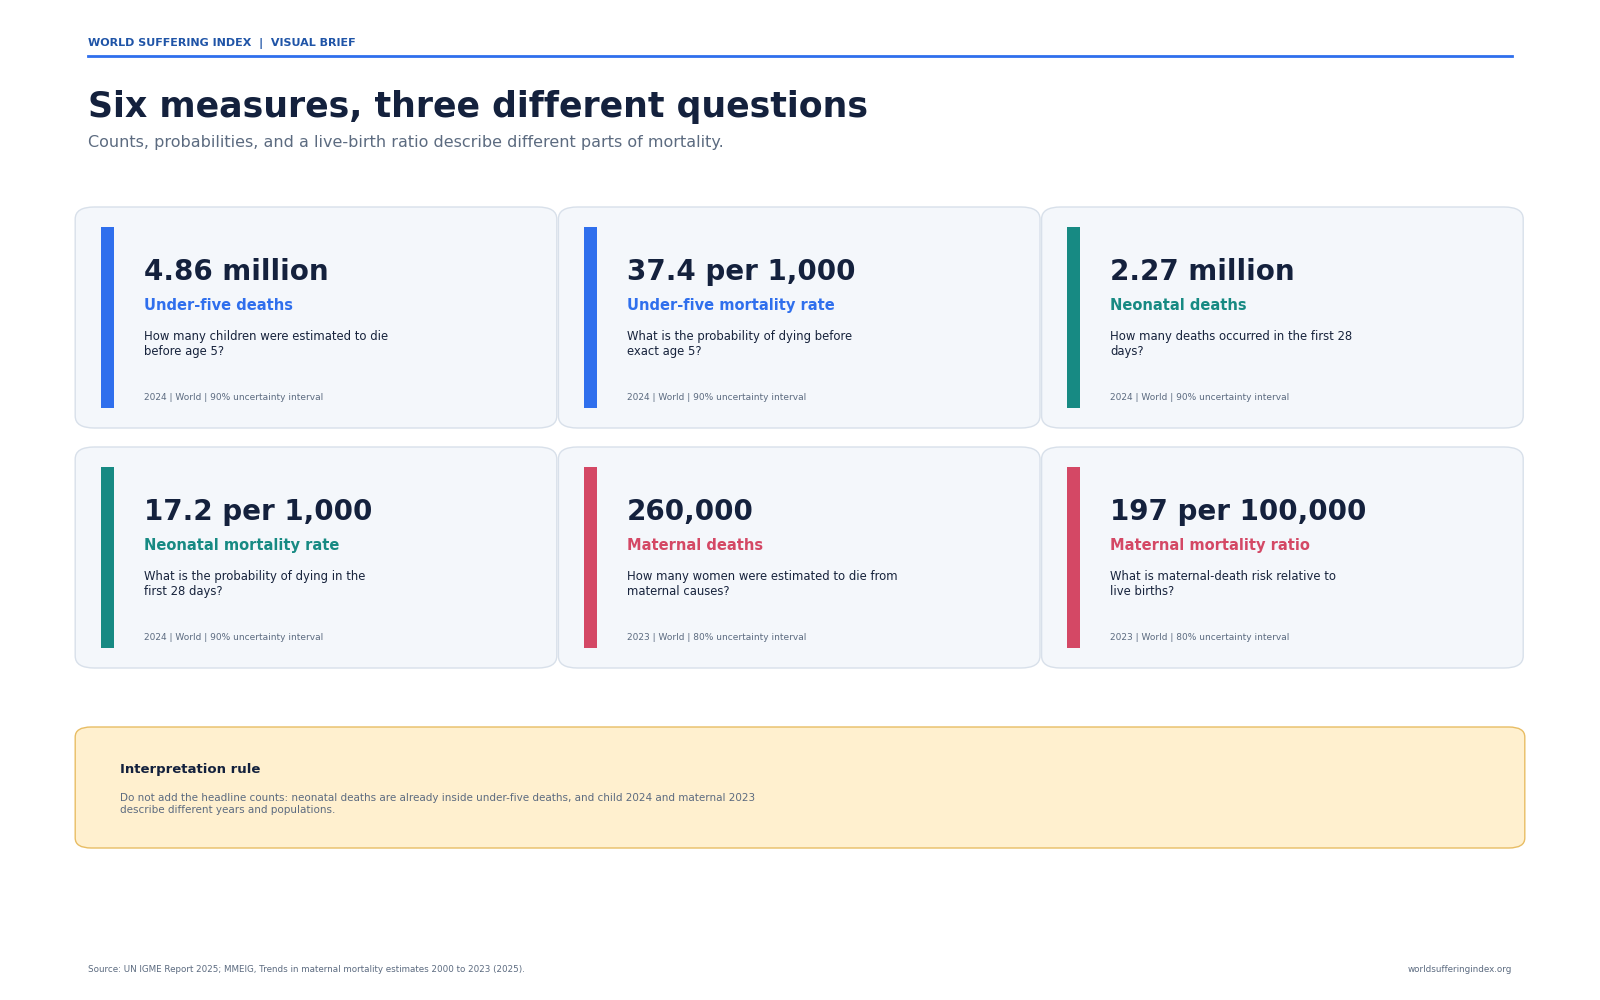
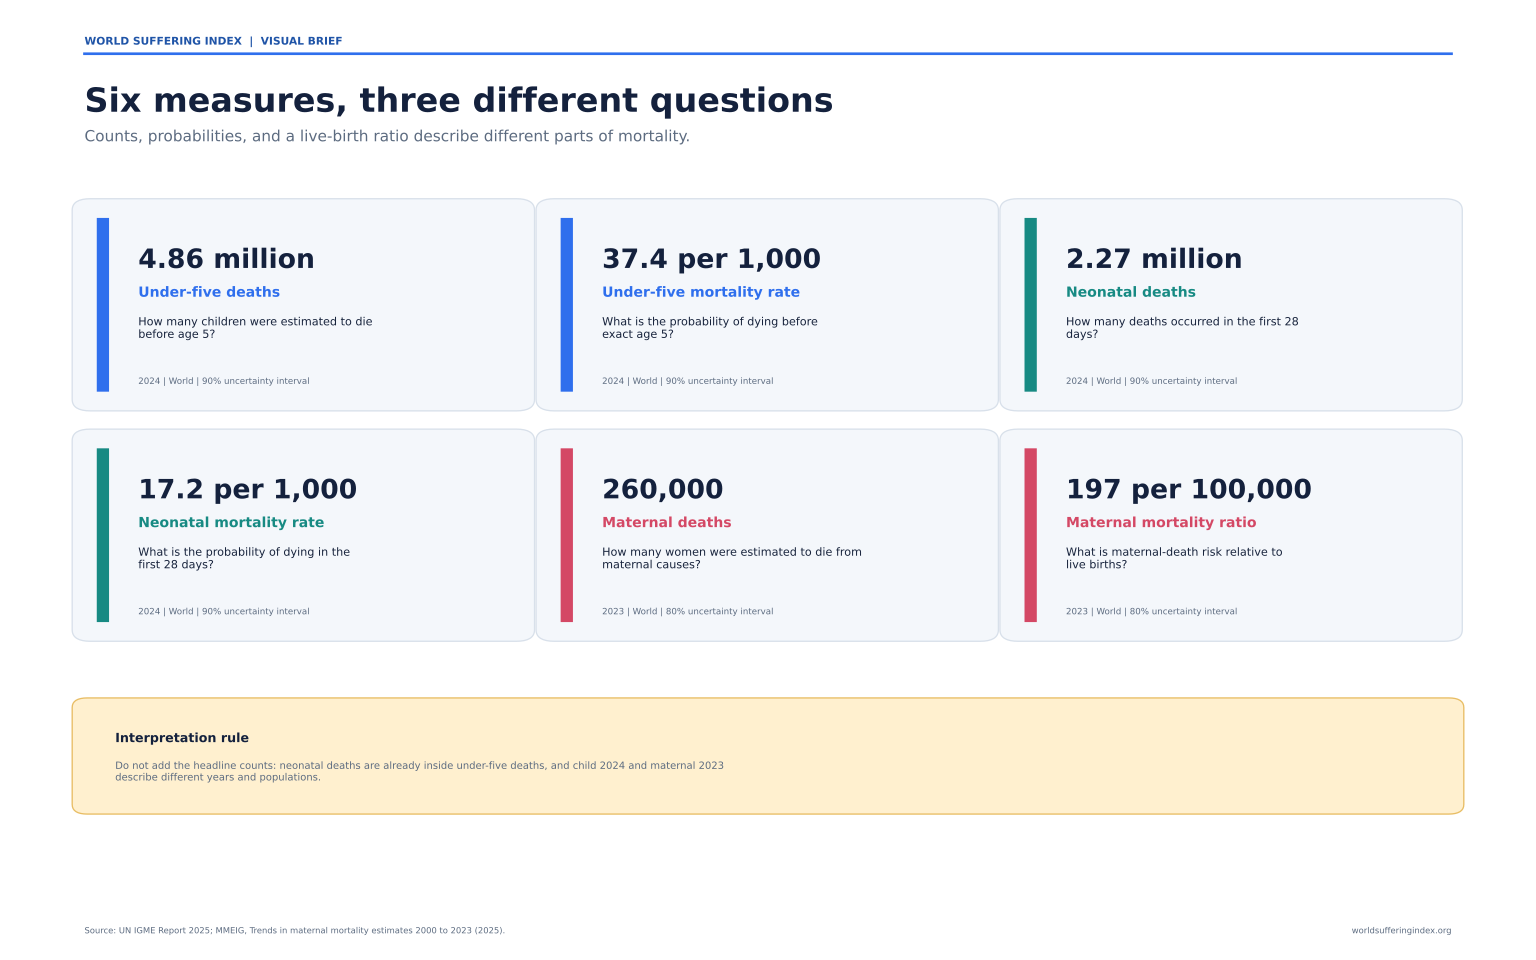
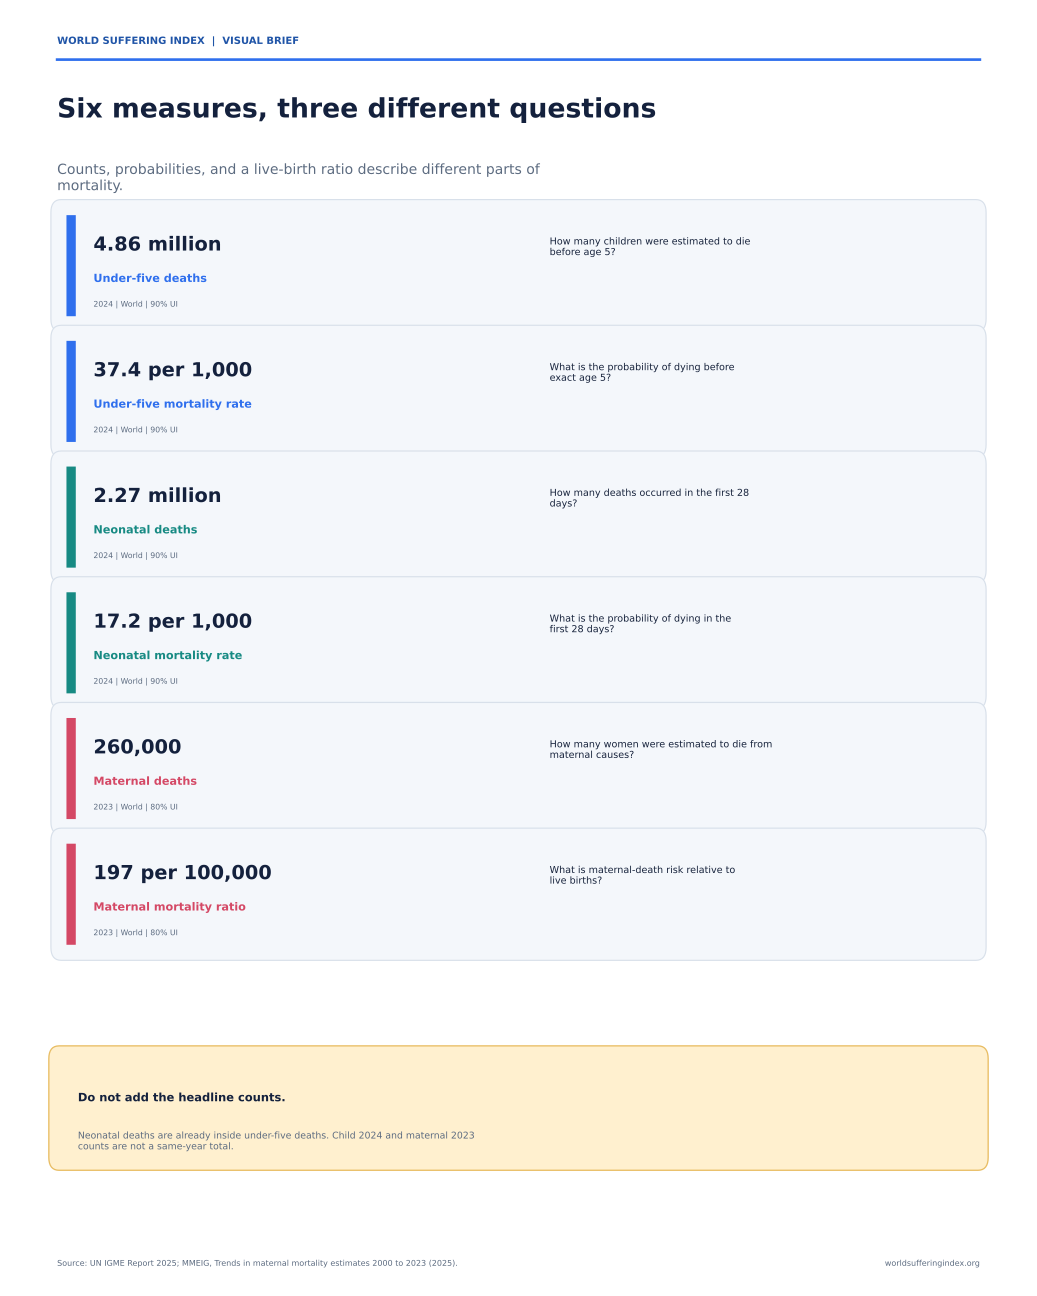
Six measures, three different questions
Six cards separate counts, age-specific probabilities, and the maternal live-birth ratio. A denominator changes the question; it does not merely rescale the same number.
Source: UN IGME, Levels & Trends in Child Mortality – Report 2025; MMEIG, Trends in maternal mortality estimates 2000 to 2023.
Measures and interpretation controls
Measures Guide links: UNIGME-U5-DEATHS UNIGME-U5MR UNIGME-NEONATAL-DEATHS UNIGME-NMR MMEIG-MATERNAL-DEATHS MMEIG-MMR
These measure definitions are active in the public Suffering Measures Guide.
02 · Rate and count
A falling rate can still mean millions of deaths
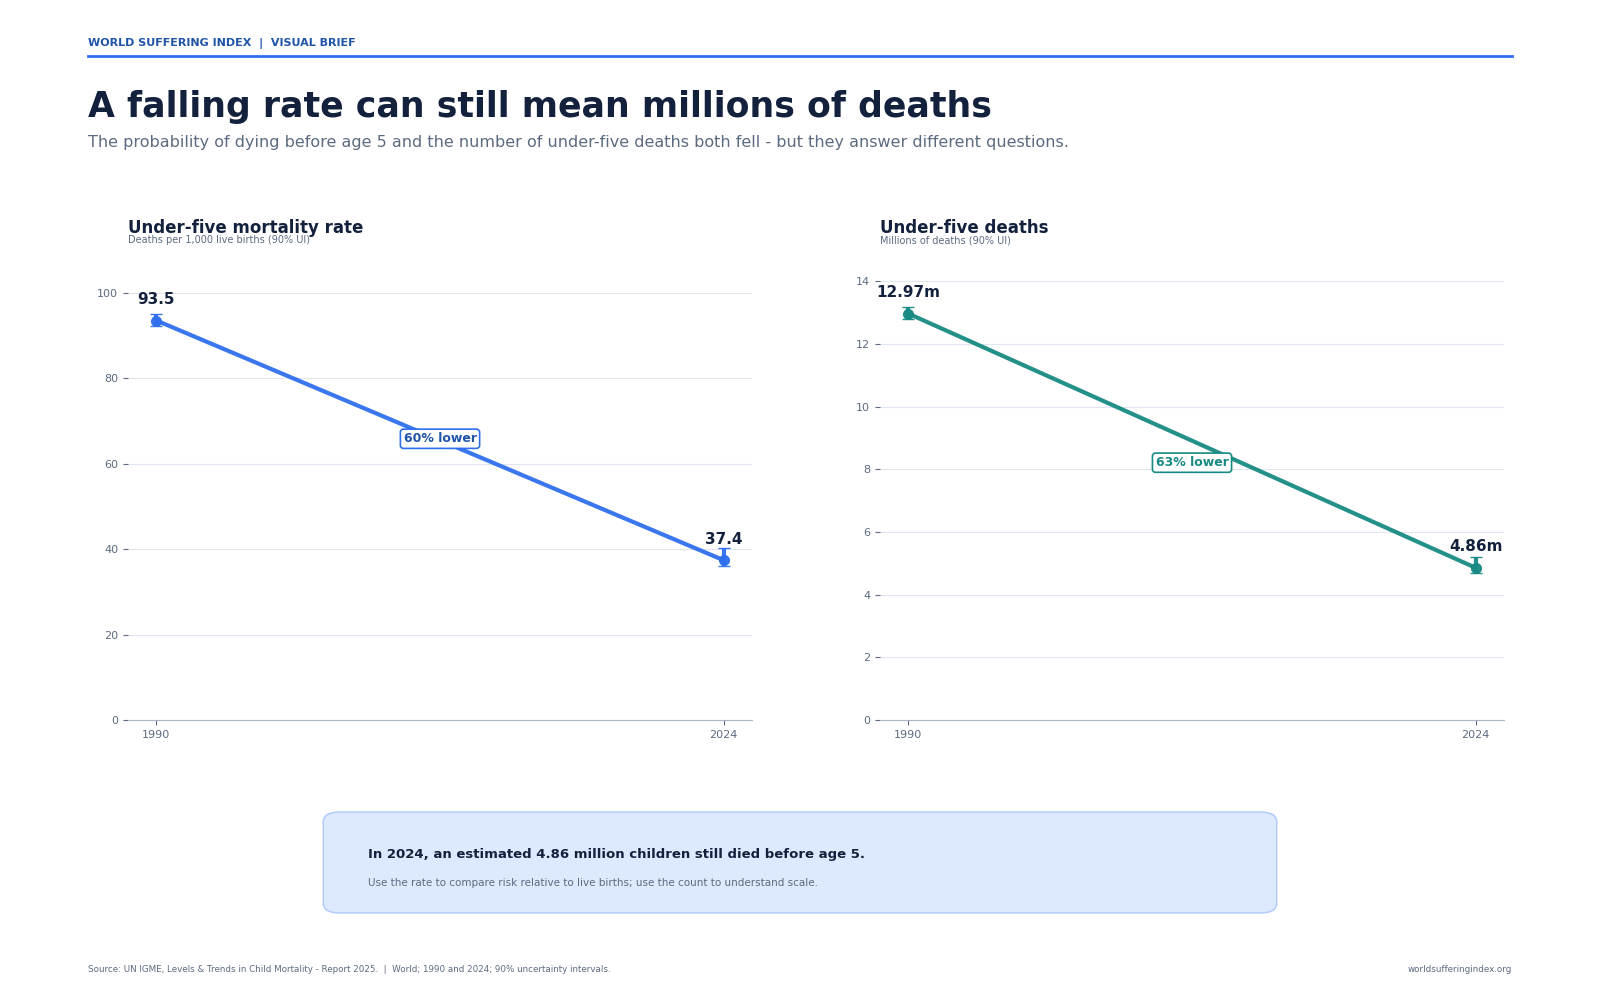
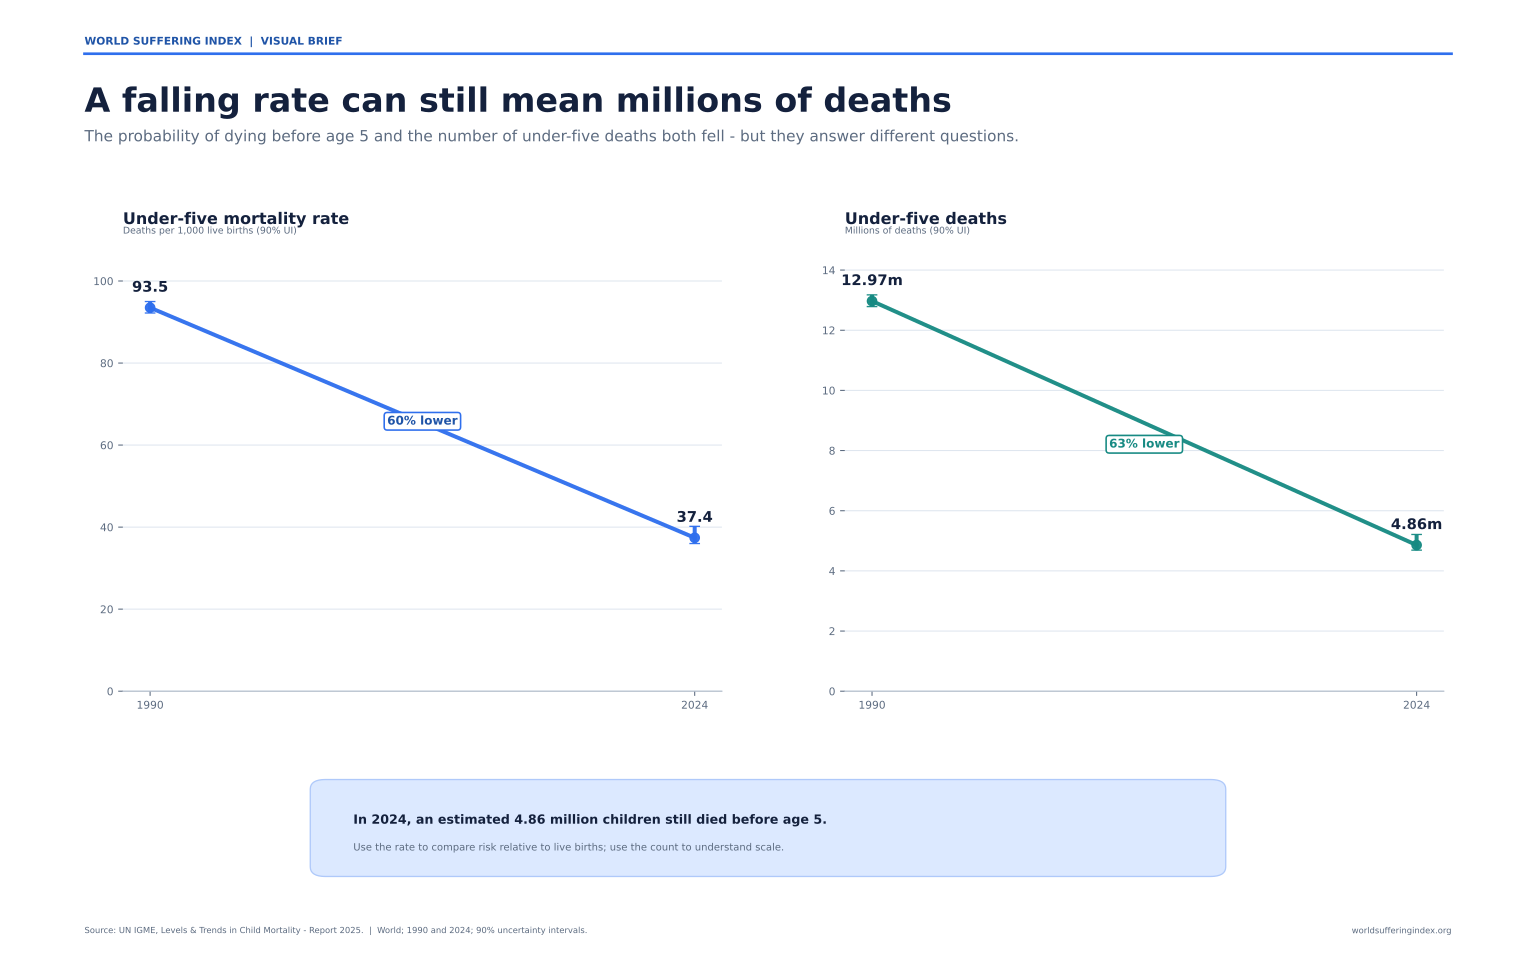
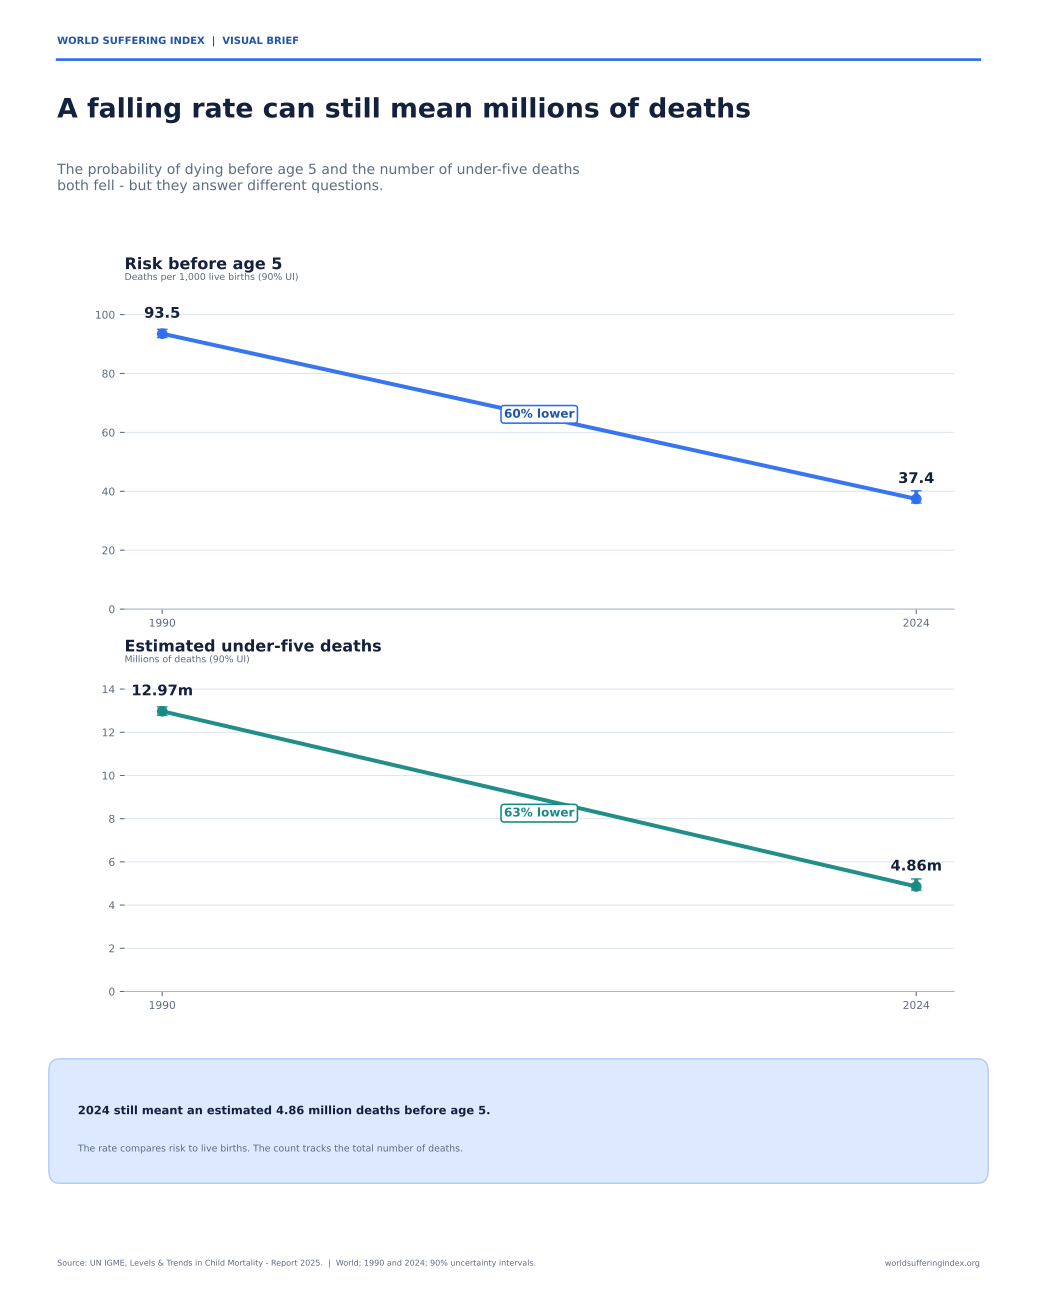
Between 1990 and 2024, the global under-five mortality rate fell 60%. The estimated number of under-five deaths fell 63%, yet 4.86 million deaths remained in 2024.
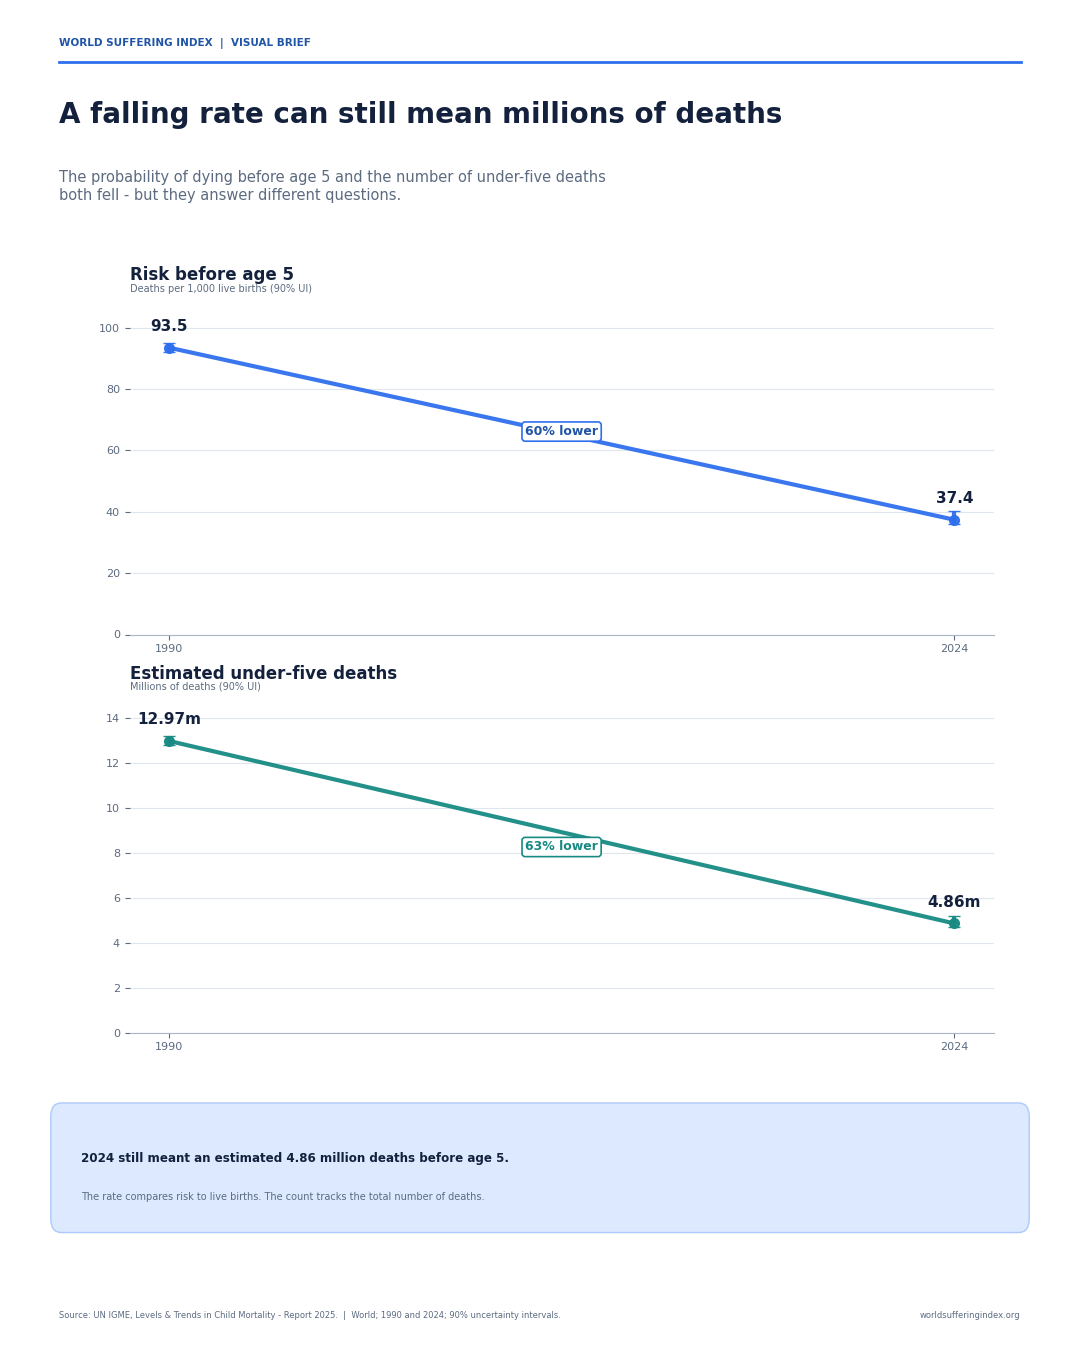
Source: UN IGME, Levels & Trends in Child Mortality – Report 2025. Child estimates use 90% uncertainty intervals.
Measures and interpretation controls
Measures Guide links: UNIGME-U5MR UNIGME-U5-DEATHS
These measure definitions are active in the public Suffering Measures Guide.
03 · Nested age interval
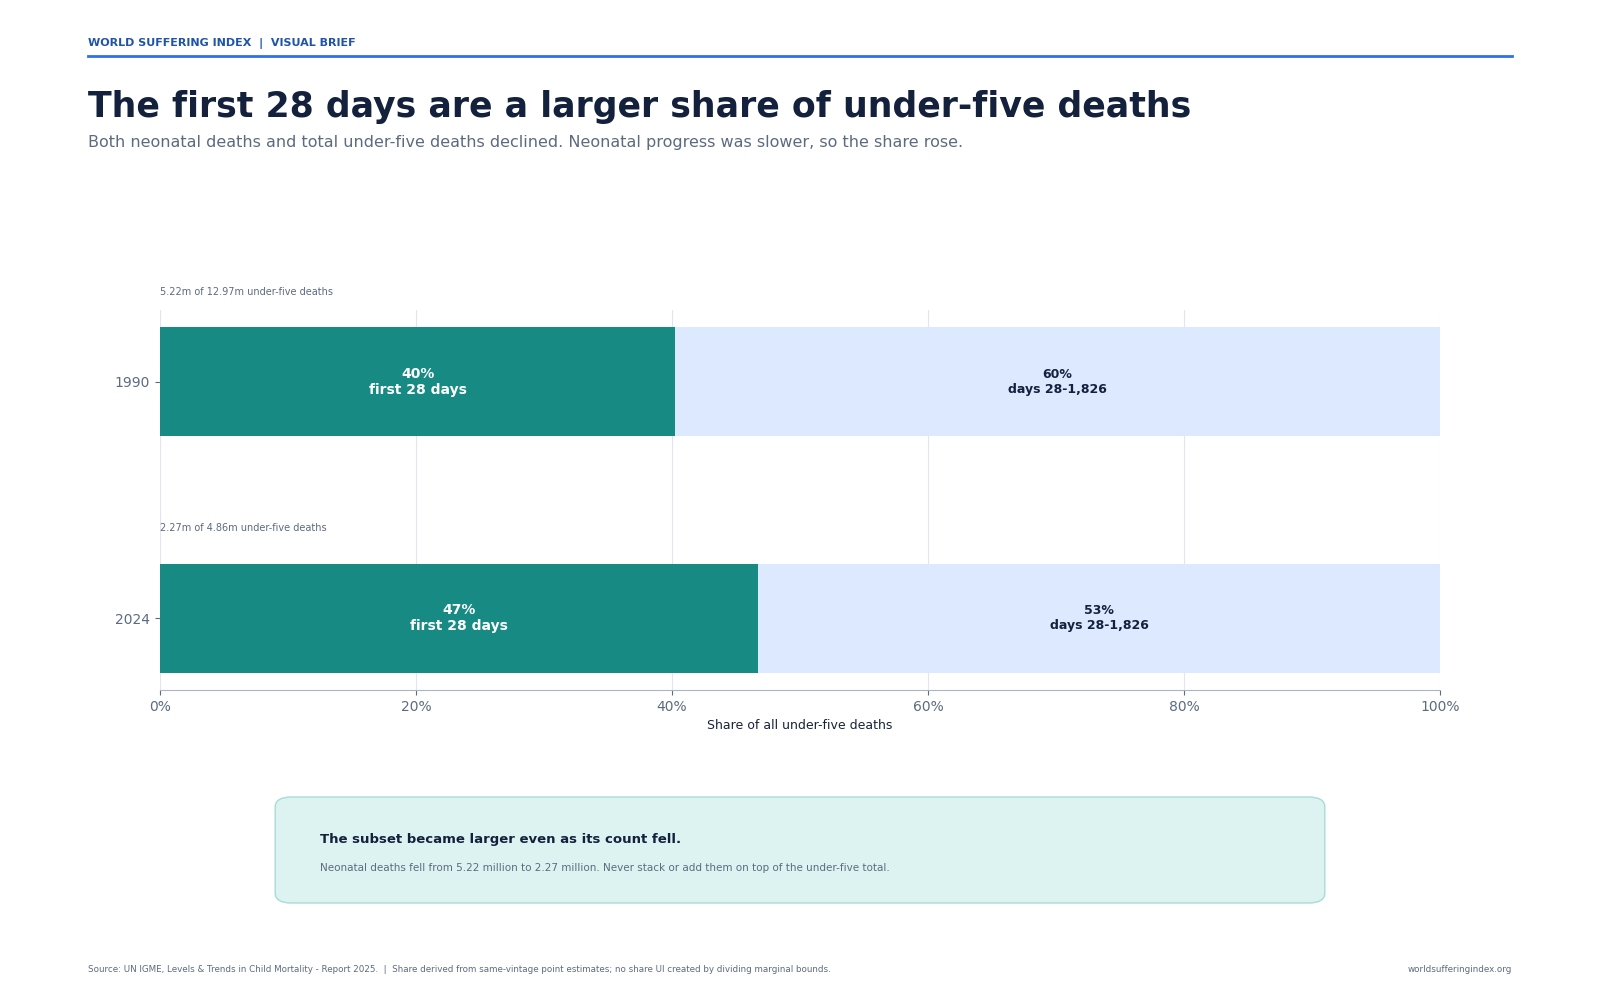
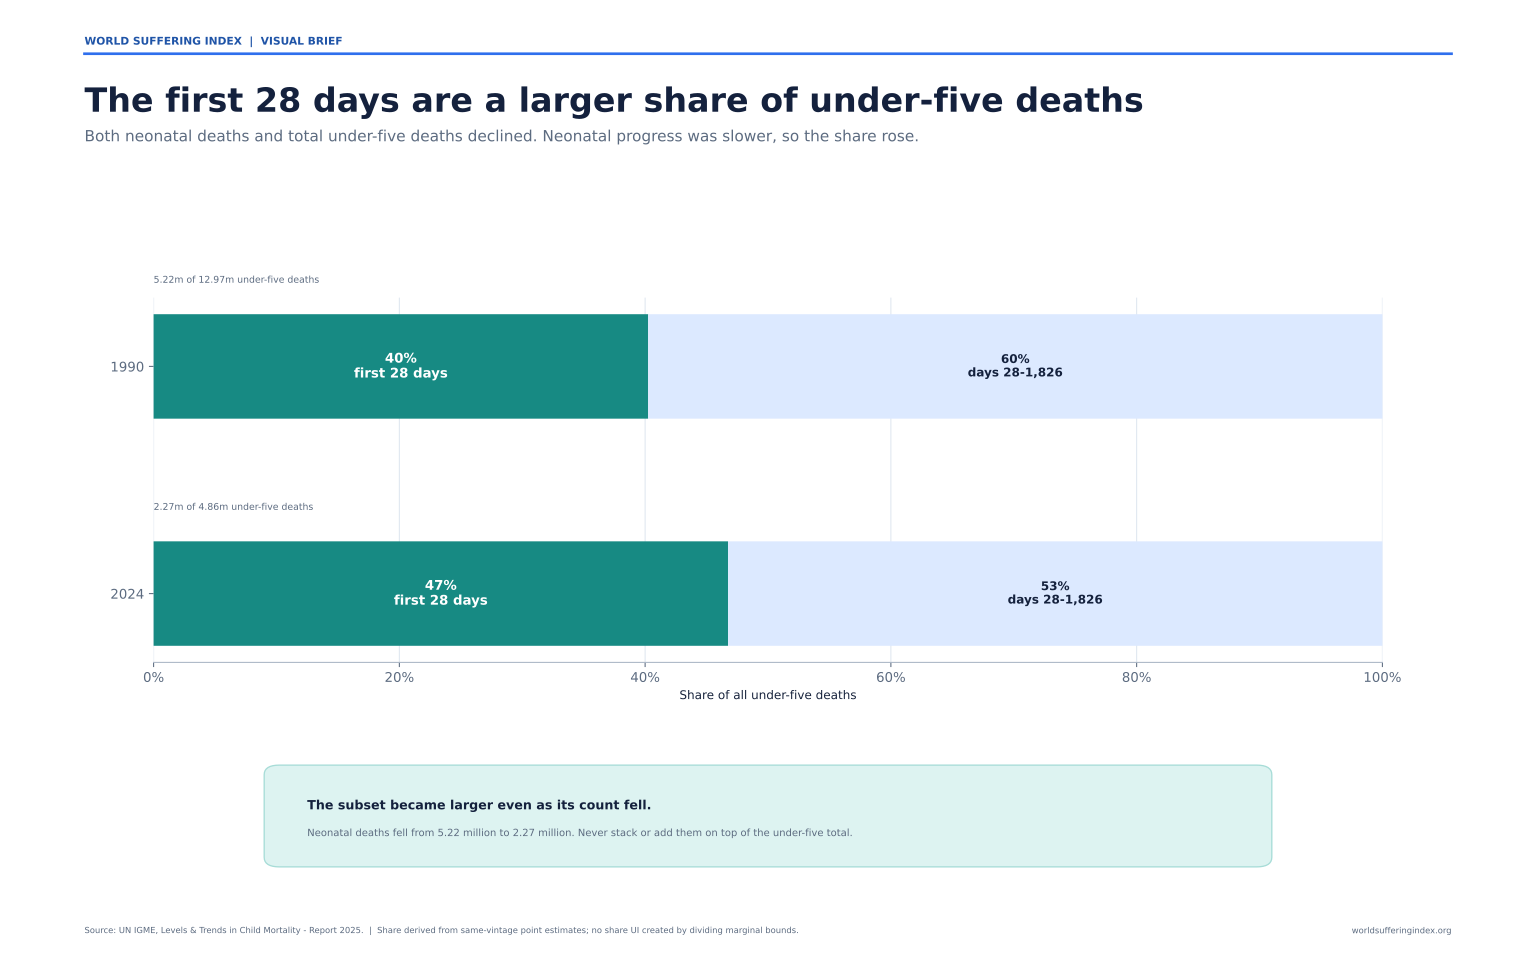
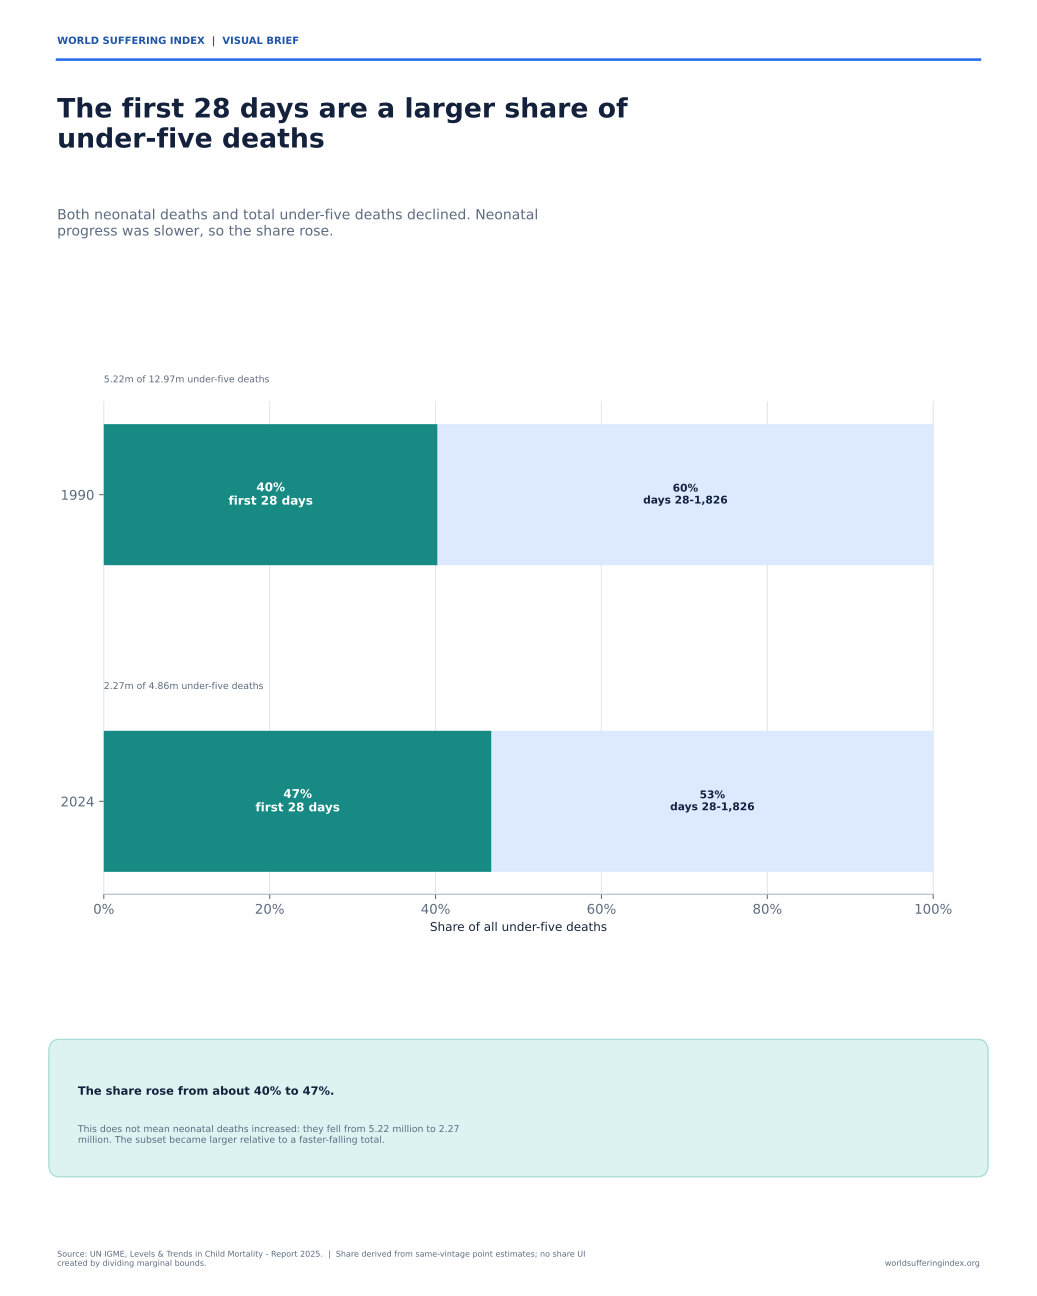
The first 28 days are a larger share of under-five deaths
Neonatal deaths fell, but more slowly than deaths later in childhood. Their share of under-five deaths rose from about 40% in 1990 to 47% in 2024. Neonatal deaths are already inside the under-five total.
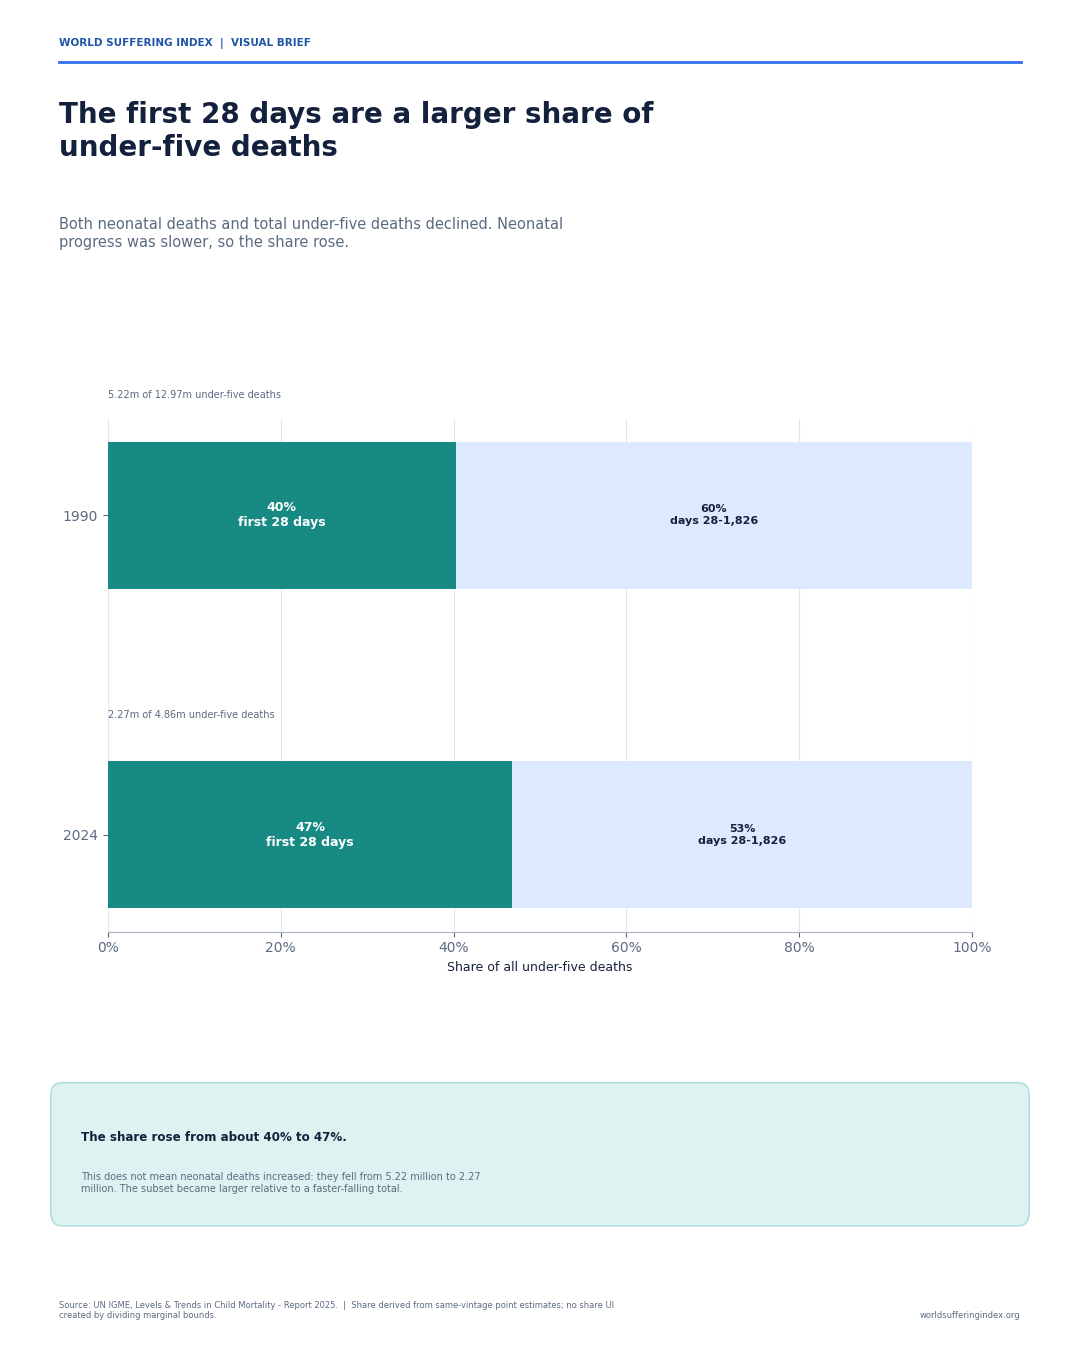
Source: UN IGME, Levels & Trends in Child Mortality – Report 2025. Shares are derived from source-reported point estimates; no share interval is inferred.
Measures and interpretation controls
Measures Guide links: UNIGME-NEONATAL-DEATHS UNIGME-U5-DEATHS UNIGME-NEONATAL-SHARE
These measure definitions are active in the public Suffering Measures Guide.
04 · Pace of change
Progress in child survival slowed after 2015
The source-reported annual rate of reduction in under-five mortality fell from 3.9% in 2000–2015 to 1.5% in 2015–2024; neonatal mortality slowed from 3.0% to 1.3%. These trend statistics do not identify a cause.
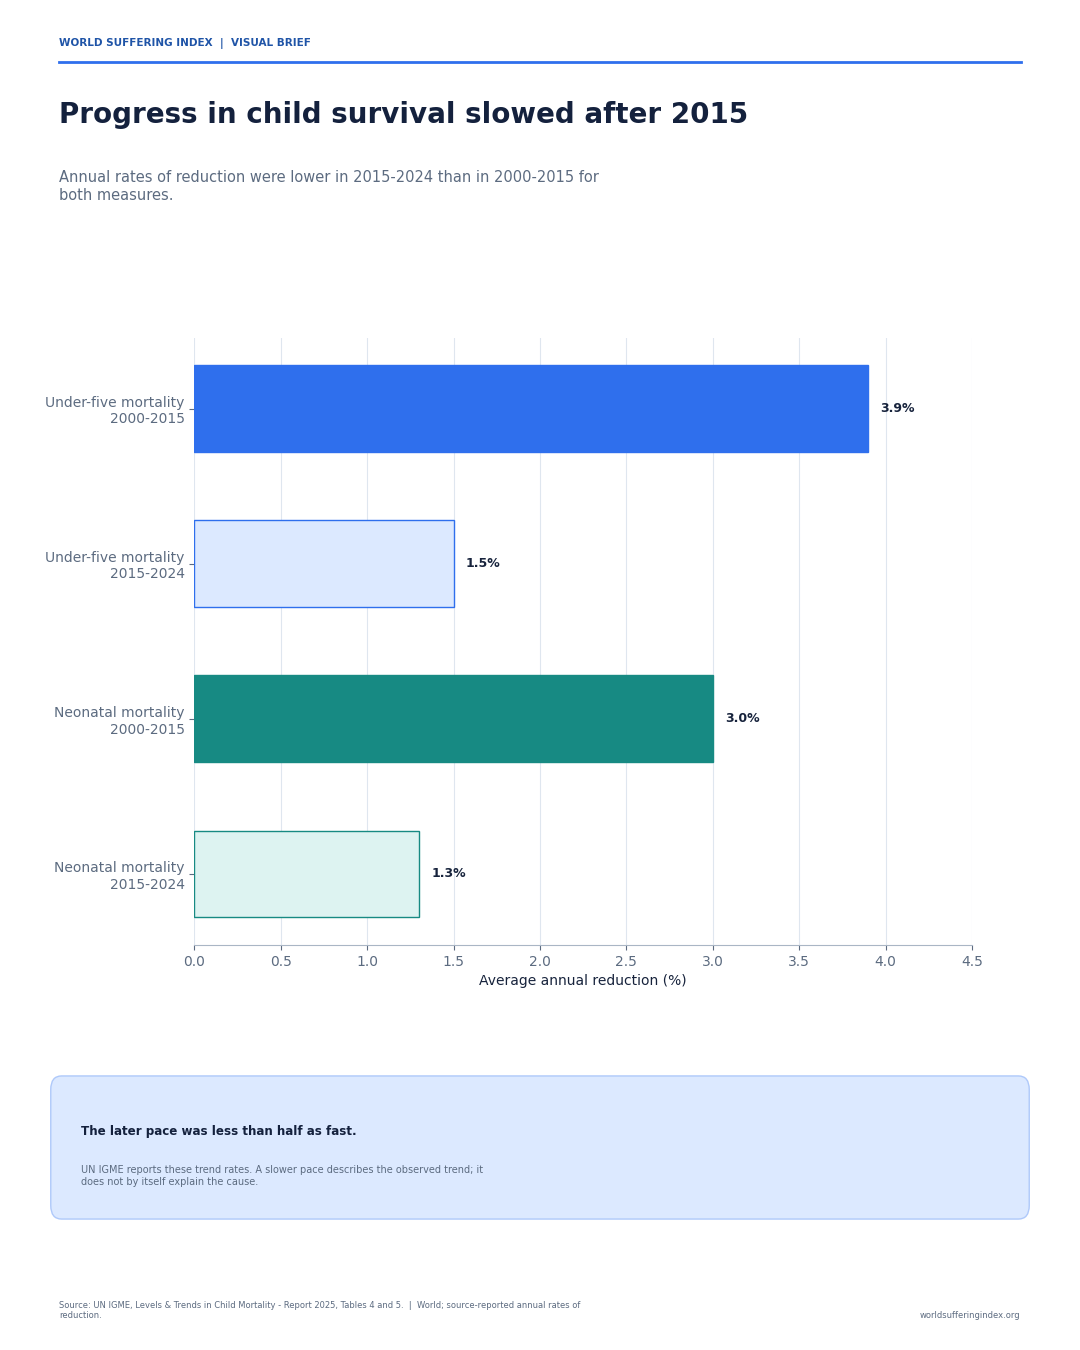
Source: UN IGME, Levels & Trends in Child Mortality – Report 2025, Tables 4 and 5.
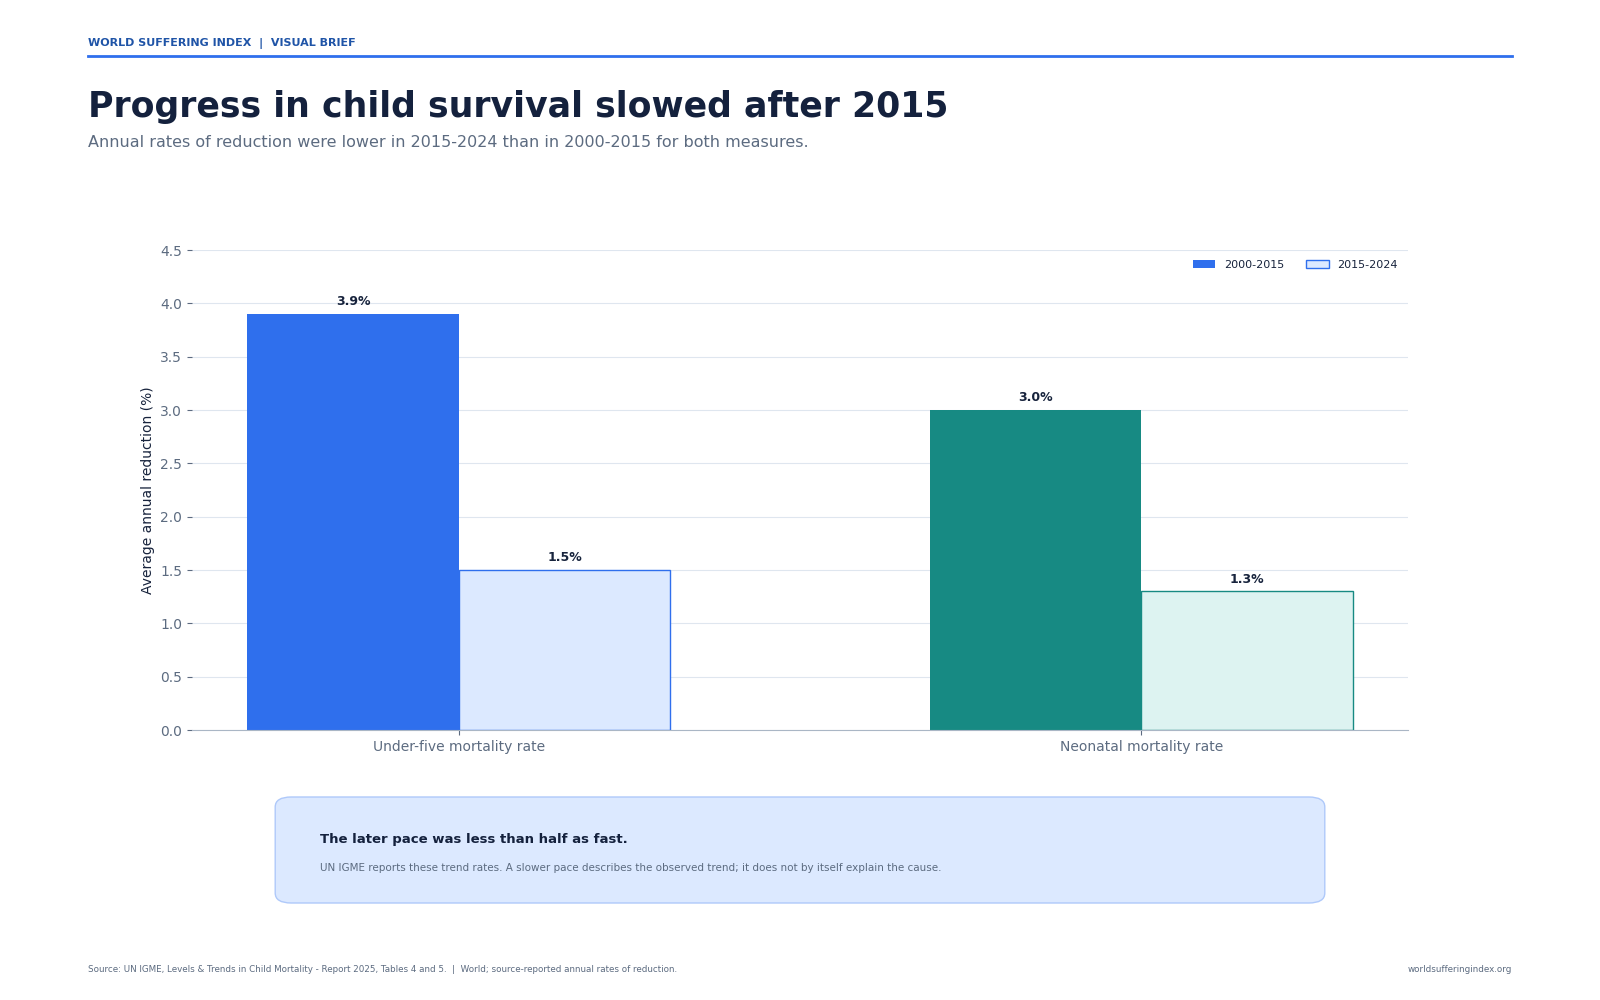
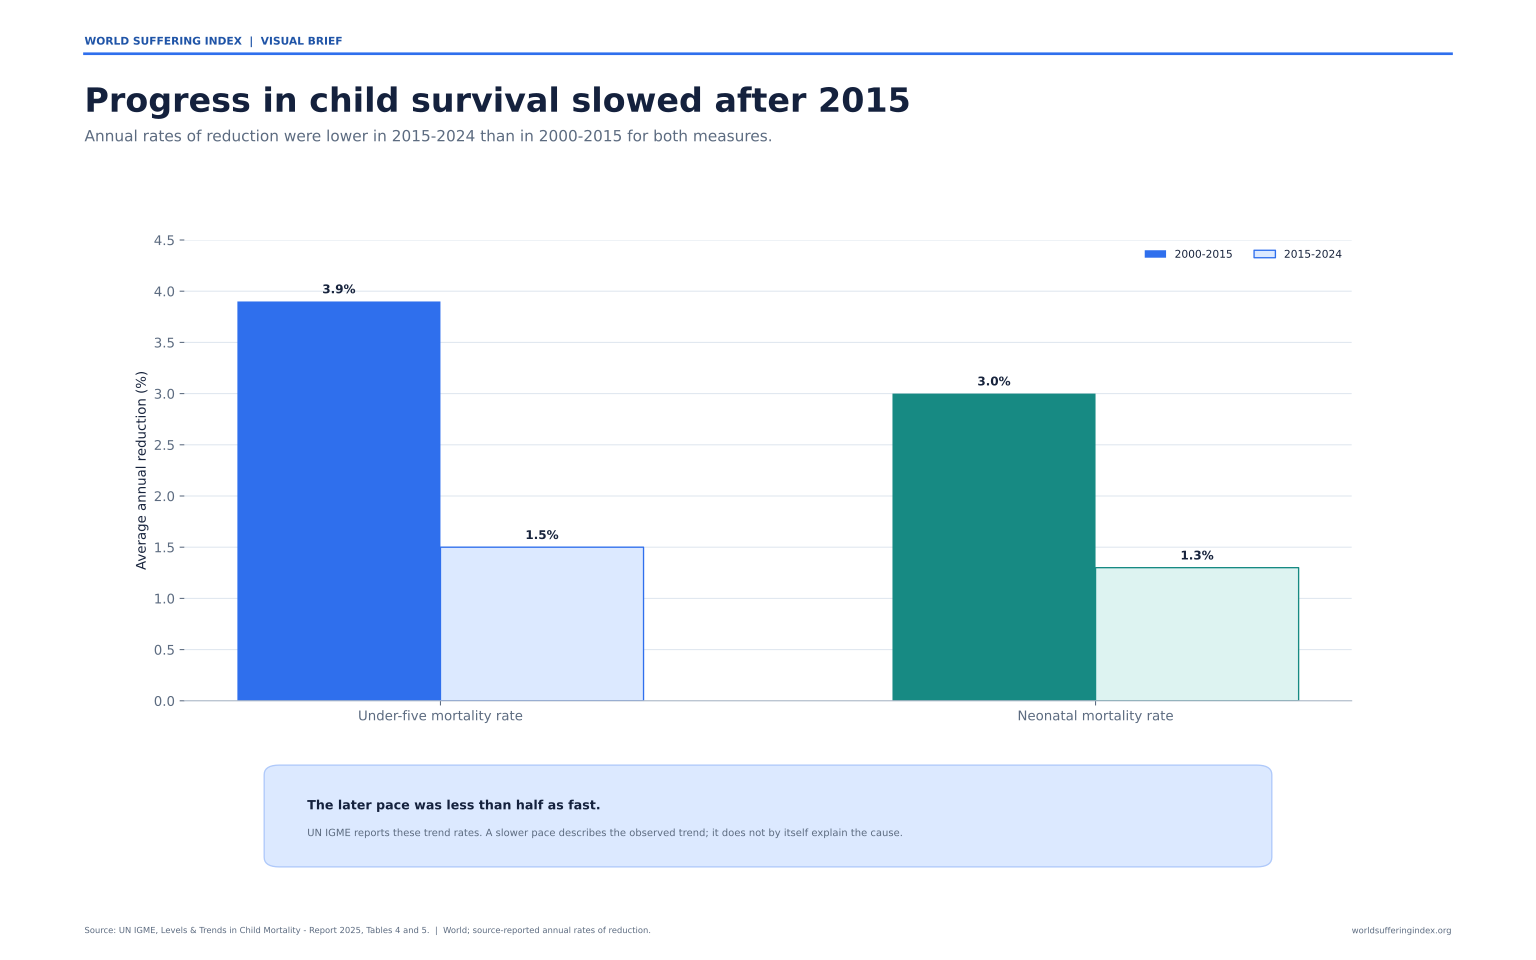
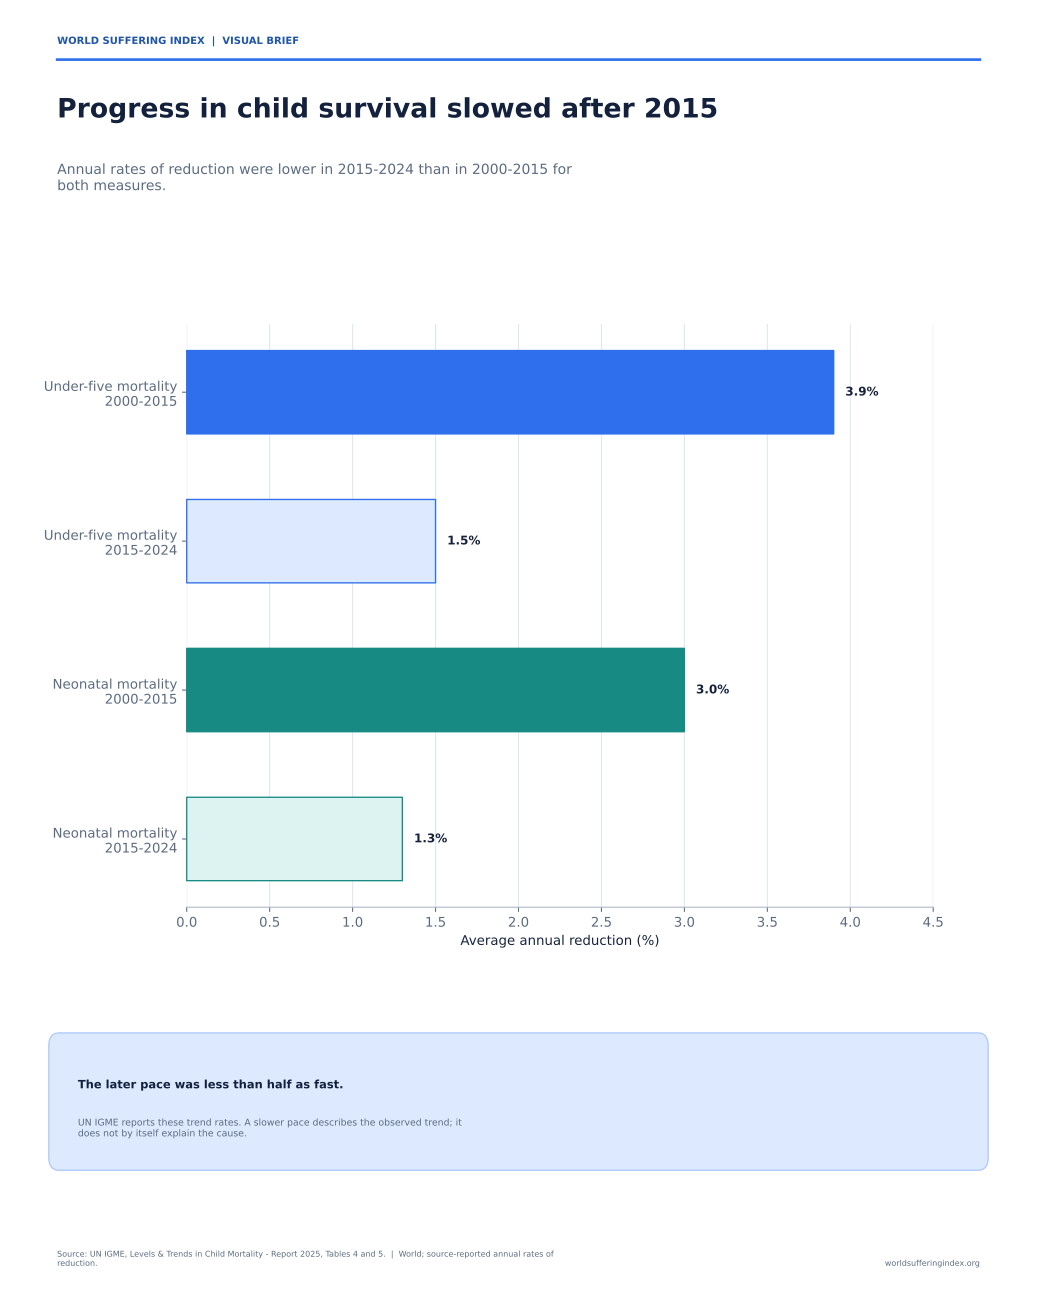
Measures and interpretation controls
Measures Guide links: UNIGME-CHILD-ARR
These measure definitions are active in the public Suffering Measures Guide.
05 · Maternal mortality
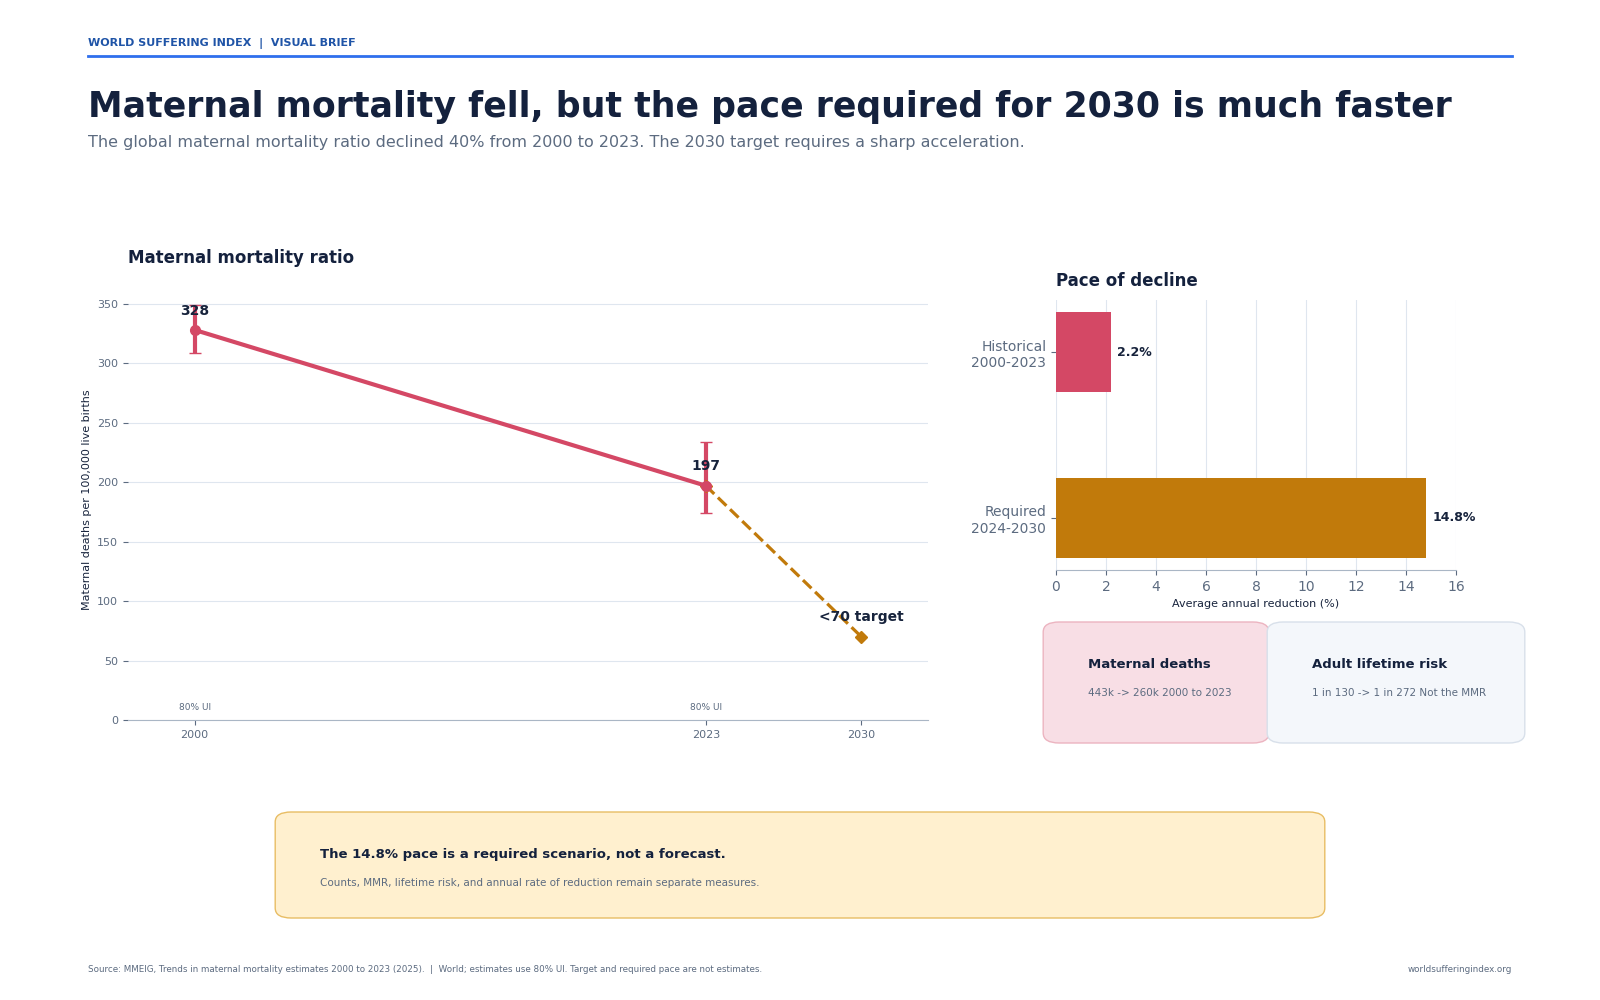
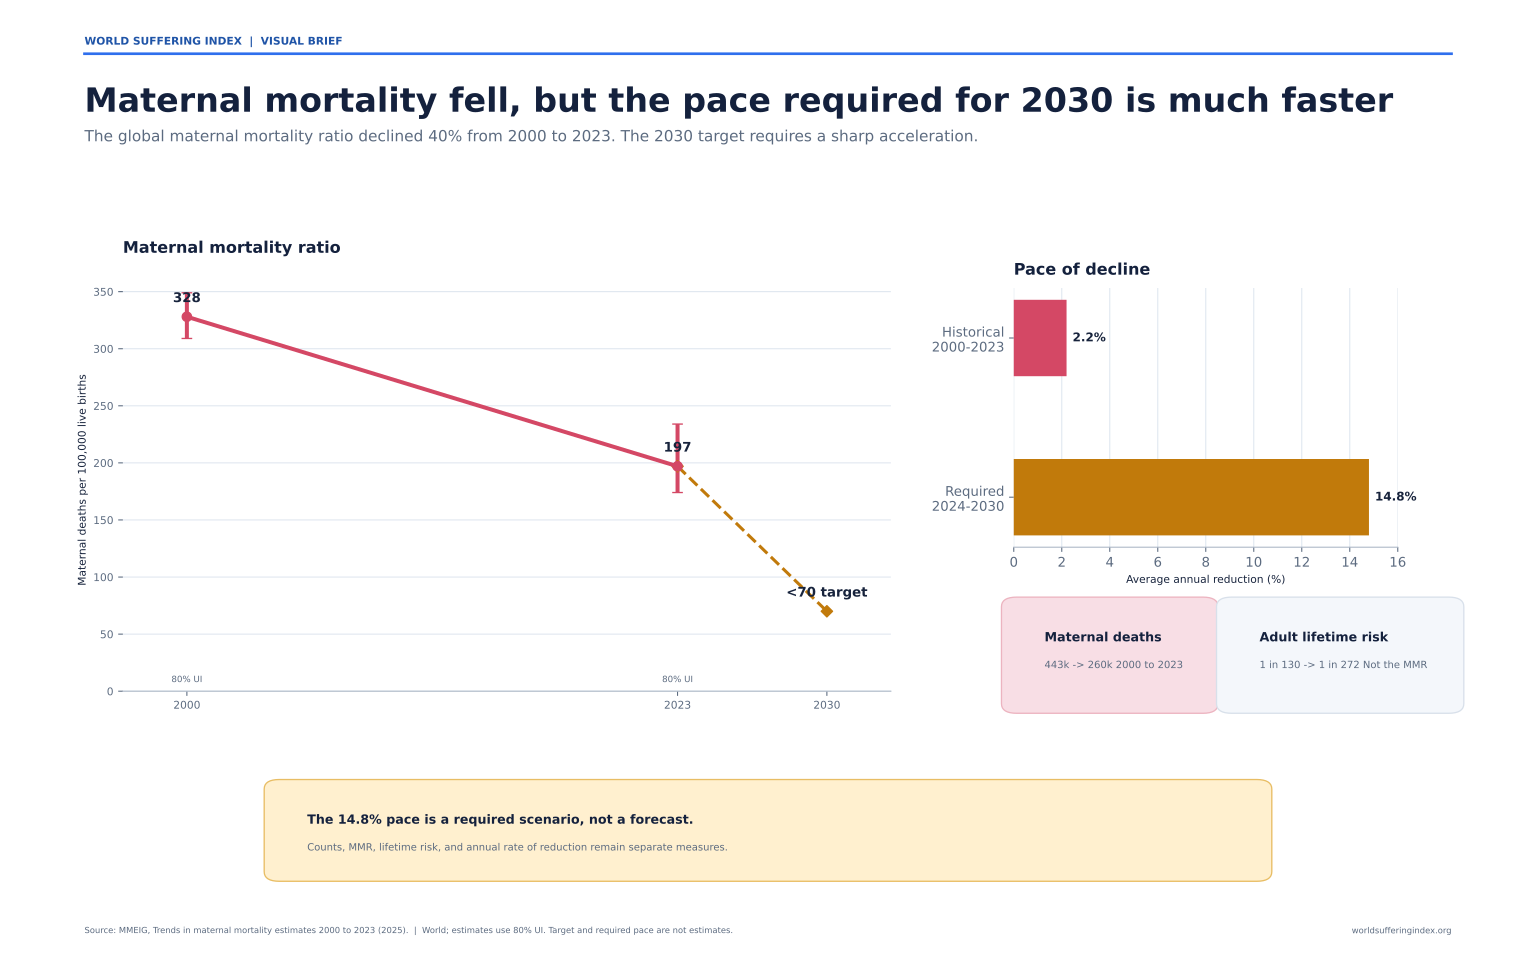
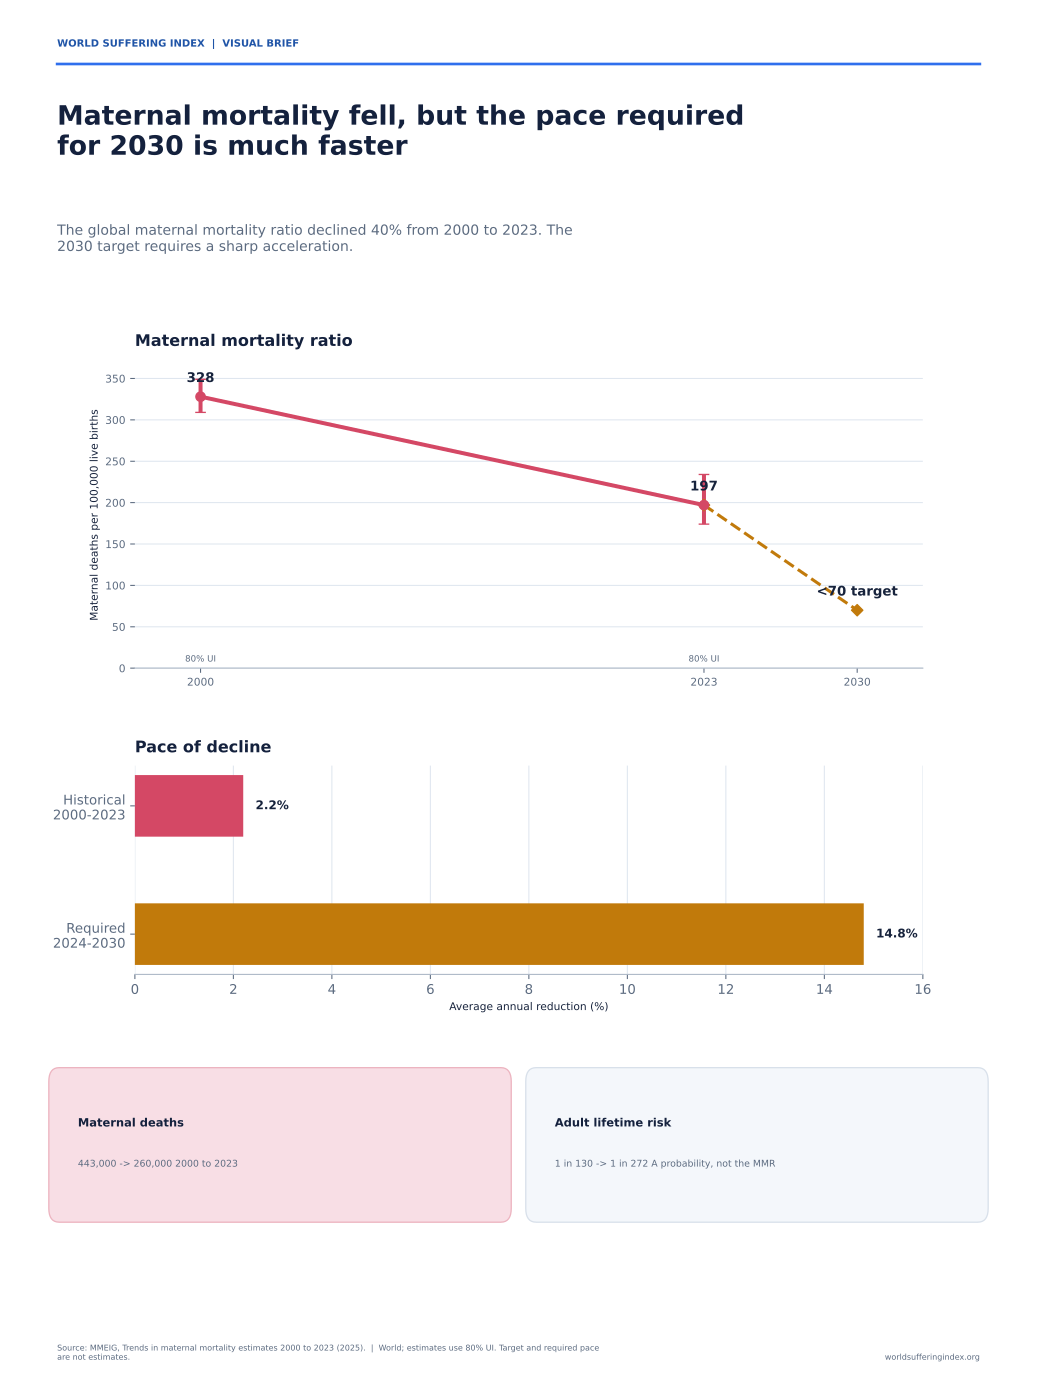
Maternal mortality fell, but the pace required for 2030 is much faster
The global maternal mortality ratio declined from 328 in 2000 to 197 in 2023. Reaching below 70 by 2030 would require a 14.8% annual reduction during 2024–2030—a target-consistent scenario, not a forecast.
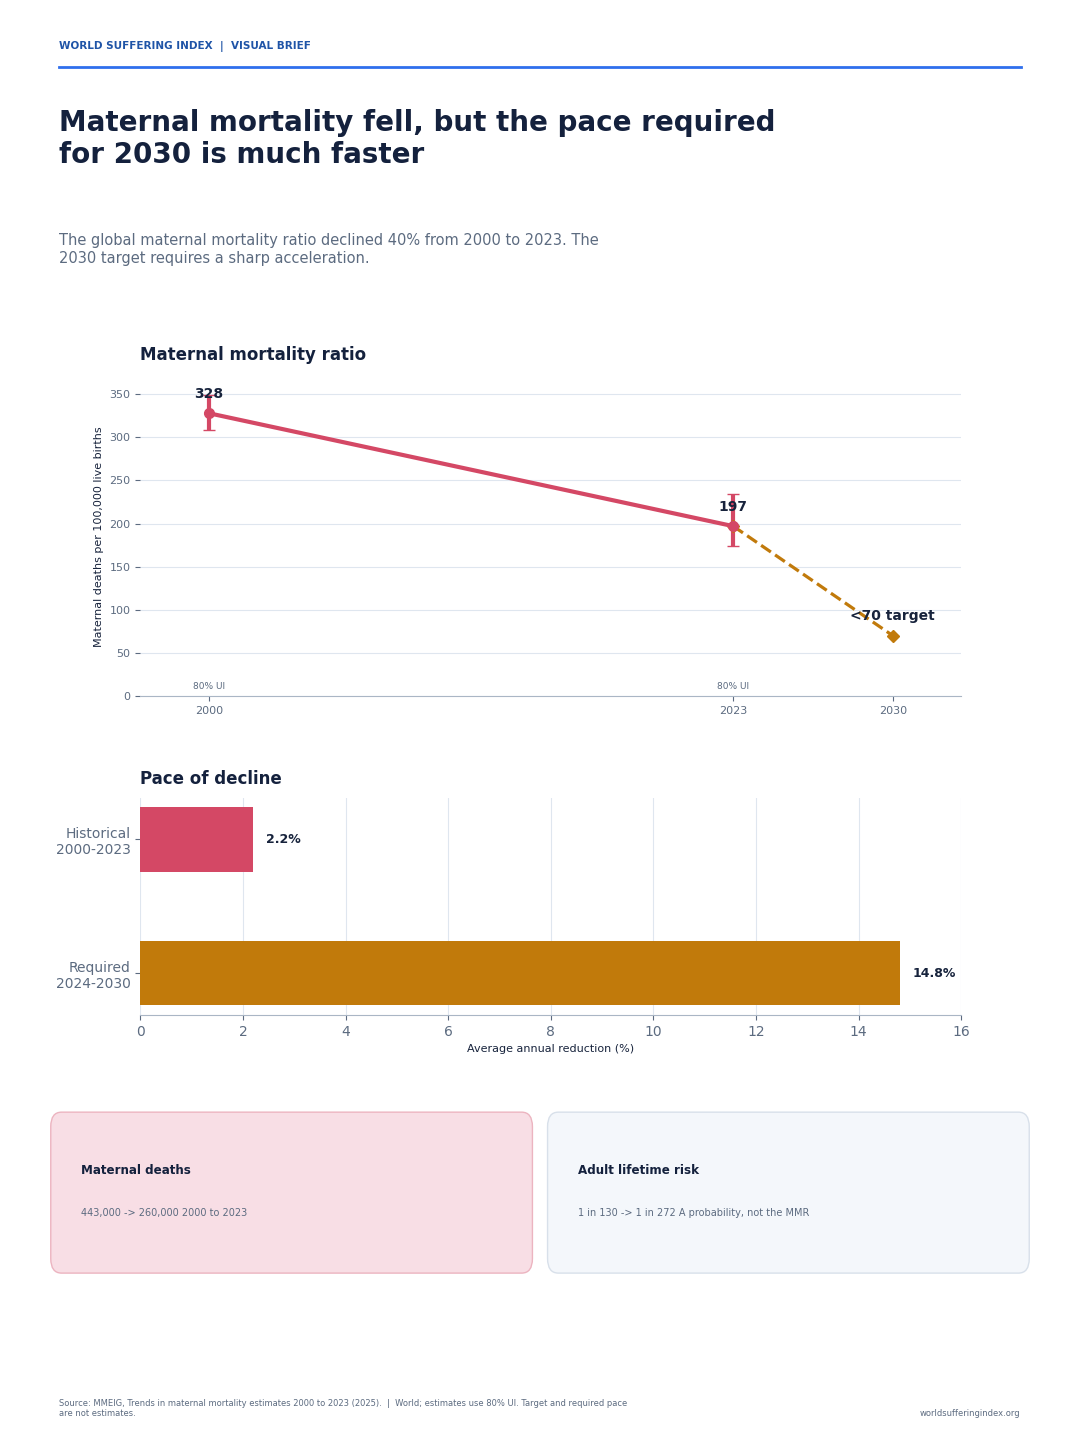
Source: MMEIG, Trends in maternal mortality estimates 2000 to 2023. Maternal estimates use 80% uncertainty intervals.
Measures and interpretation controls
Measures Guide links: MMEIG-MMR MMEIG-MATERNAL-DEATHS MMEIG-LIFETIME-RISK MMEIG-MMR-ARR SDG-MMR-TARGET
These measure definitions are active in the public Suffering Measures Guide.
06 · Regional context
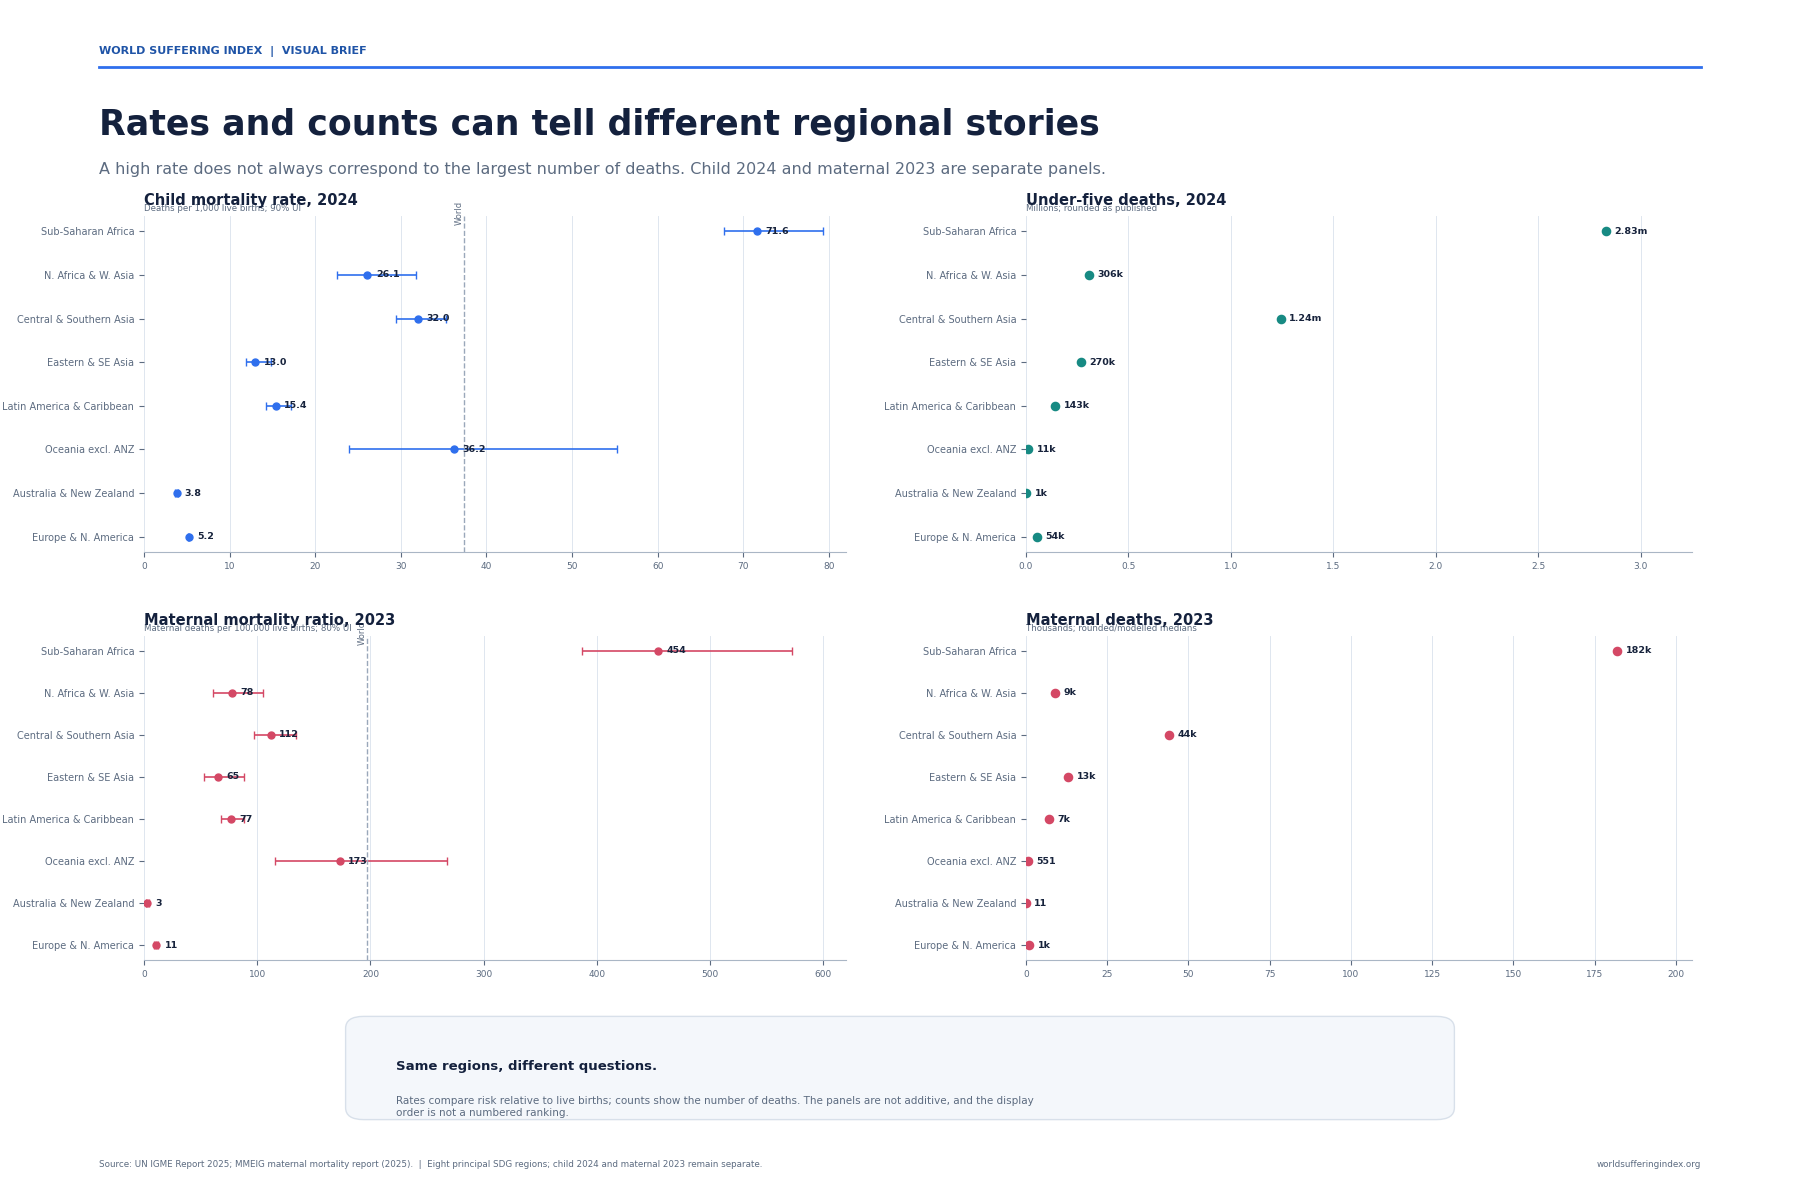
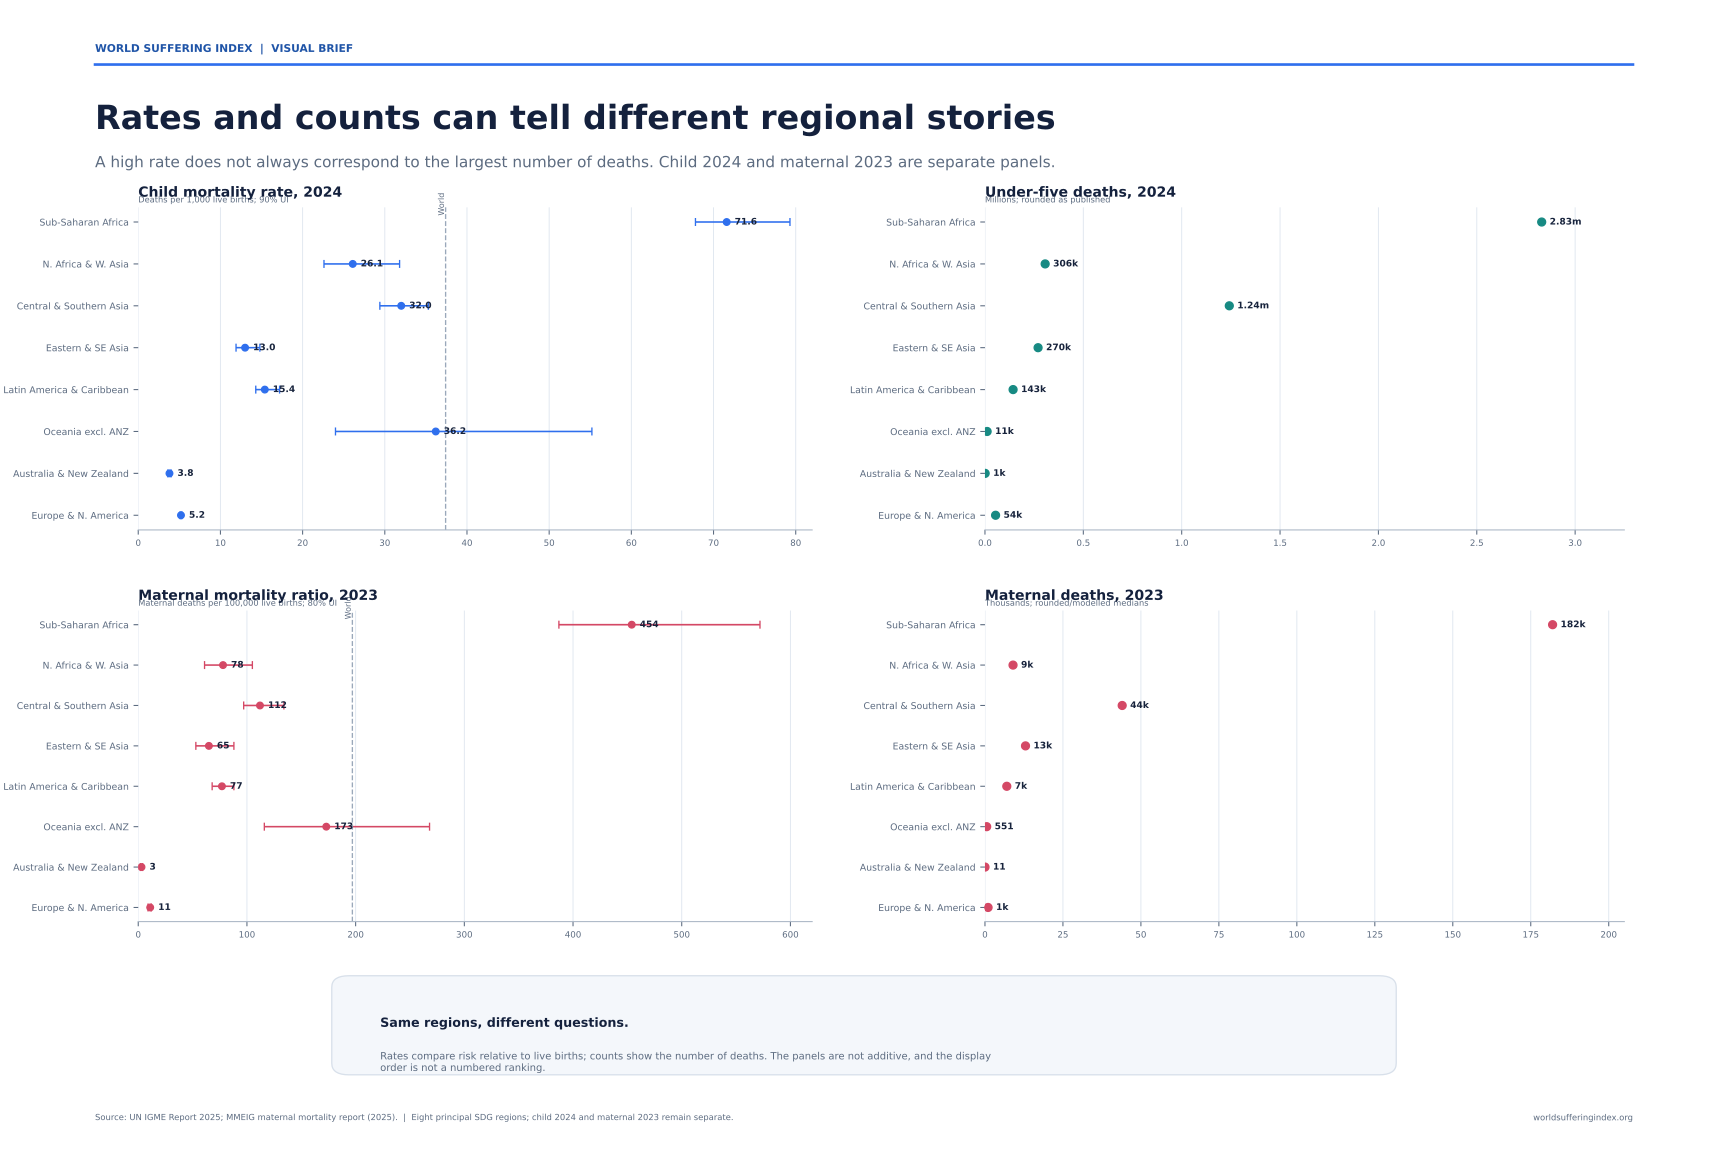
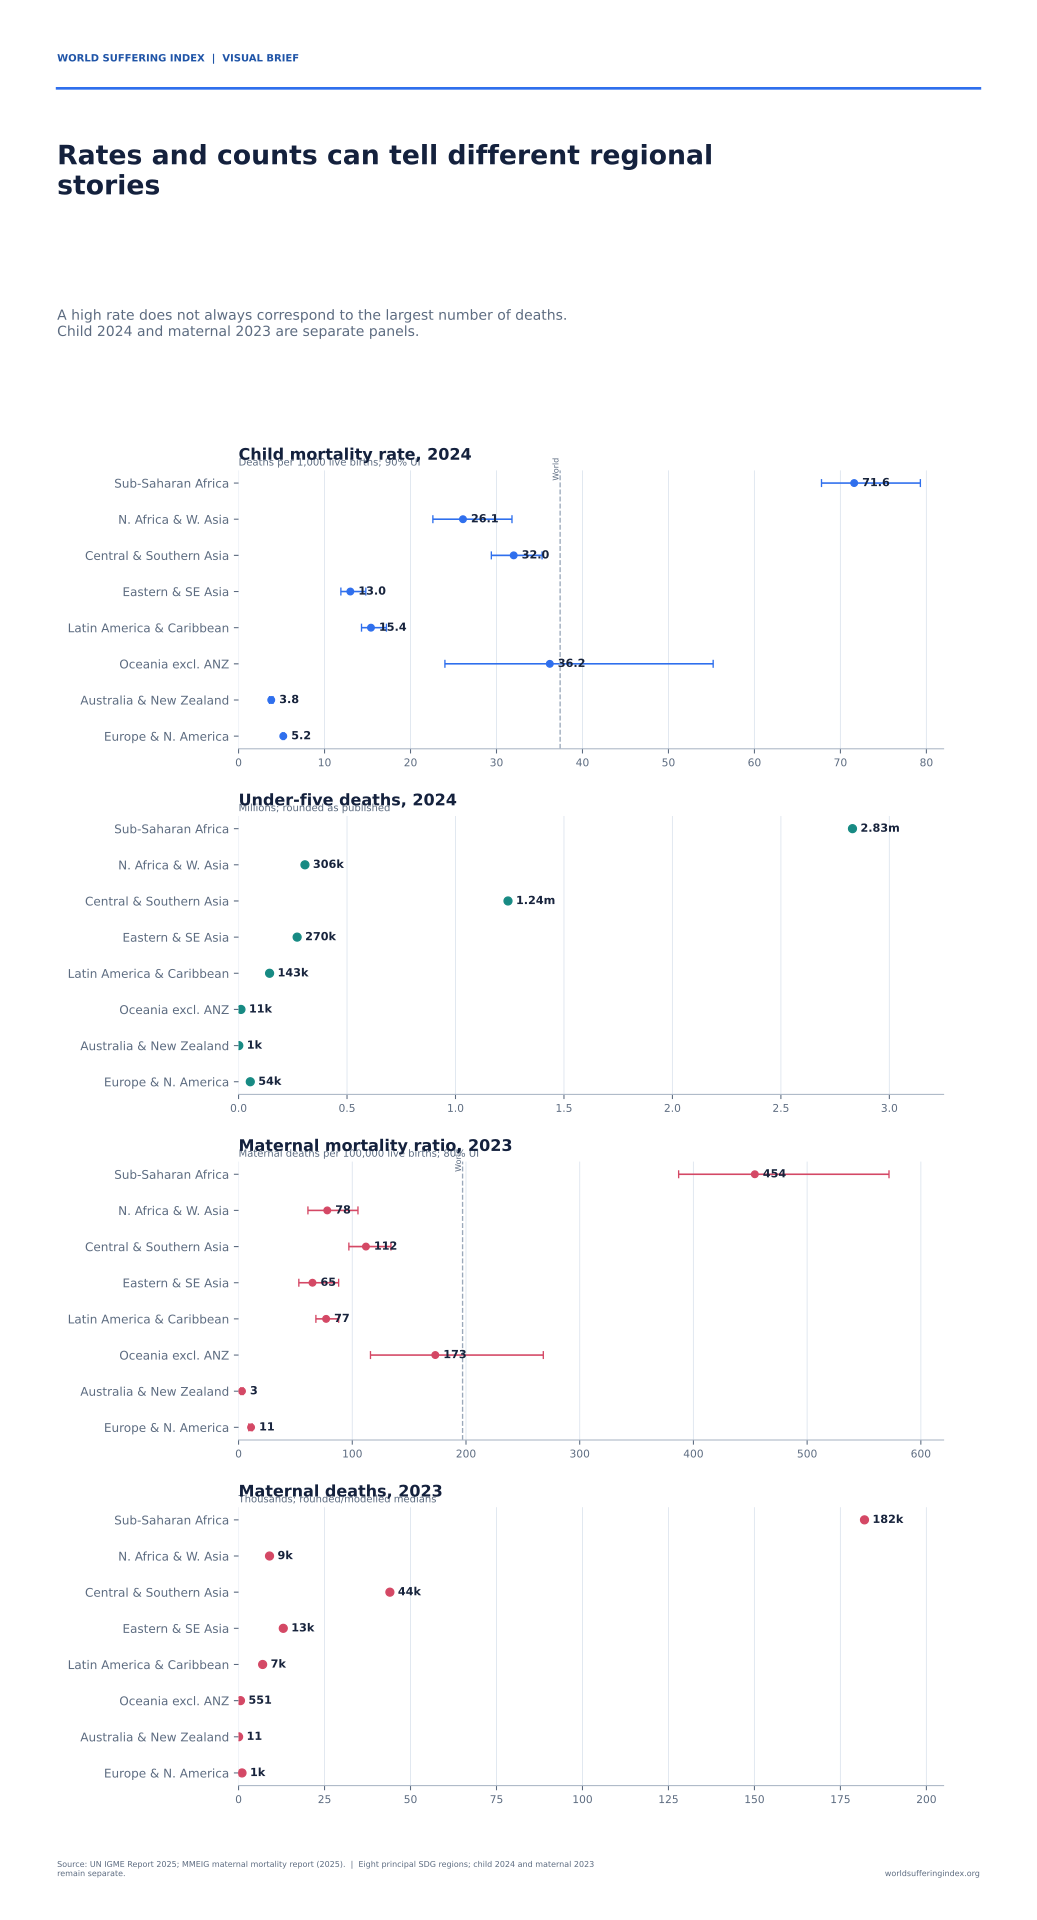
Rates and counts can tell different regional stories
Regional rates compare risk relative to live births, while counts show total scale. The same region can look different under the two measures. Child 2024 and maternal 2023 remain separate panels, not a combined ranking.
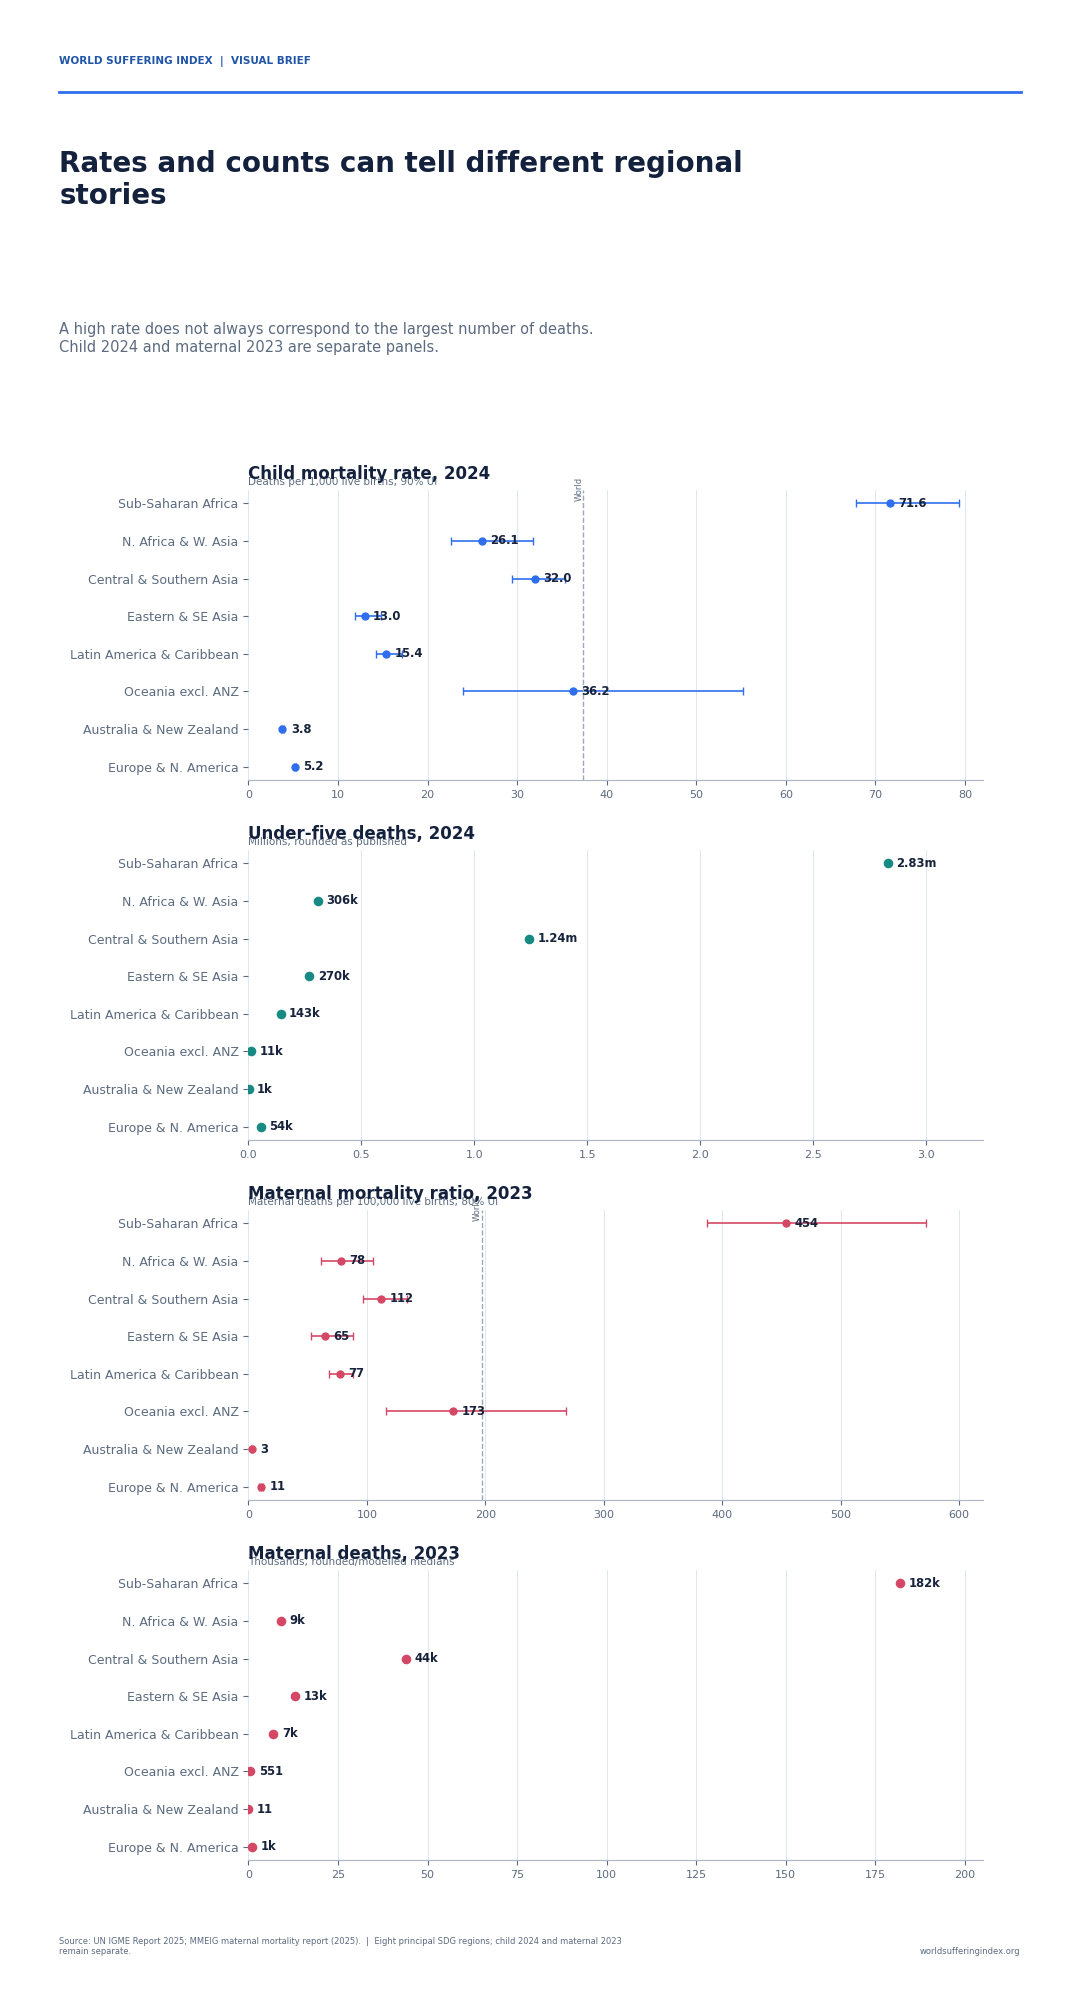
Source: UN IGME 2025 release for child mortality (2024); MMEIG 2025 release for maternal mortality (2023); eight principal SDG regions.
Measures and interpretation controls
Measures Guide links: UNIGME-U5MR UNIGME-U5-DEATHS MMEIG-MMR MMEIG-MATERNAL-DEATHS
These measure definitions are active in the public Suffering Measures Guide.
How to read the evidence
Keep the measure attached to its question
Counts show total scale. Rates and ratios introduce a denominator. Shares describe a subset of a total. Lifetime risk uses a different probability construct. Annual rates of reduction describe change over a period. None becomes interchangeable simply because the numbers appear in the same story.
Neonatal deaths occur within the under-five total; they are not added on top.
U5MR and NMR are per 1,000 live births; MMR is per 100,000 live births.
Child estimates use 90% uncertainty intervals; maternal estimates use 80% intervals.
Latest child estimates are for 2024; latest maternal estimates are for 2023.
Published regional and world aggregates control their own geographies; no forced summation.
No country ranking, causal attribution, combined mortality total, or mortality-to-USU conversion.
Measures in this brief
4.86 million in 2024
Count of estimated deaths before exact age 5 during the year.
Deaths; 90% UI 4.69-5.21 millionRelationship rule
Neonatal deaths are included.
37.4 per 1,000 live births in 2024
Probability of dying before exact age 5 under current conditions.
Deaths per 1,000 live births; 90% UI 36.0-40.2Relationship rule
Not additive with neonatal mortality rate.
2.27 million in 2024
Count of estimated deaths from birth to exact day 28.
Deaths; 90% UI 2.15-2.49 millionRelationship rule
Subset of under-five deaths.
17.2 per 1,000 live births in 2024
Probability of dying from birth to exact day 28.
Deaths per 1,000 live births; 90% UI 16.3-18.8Relationship rule
Nested age interval; not additive with U5MR.
260,000 in 2023
Estimated deaths from maternal causes in the reference year.
Deaths; 80% UI 230,000–308,000Relationship rule
Separate period and population from child mortality.
197 per 100,000 live births in 2023
Maternal deaths relative to live births in the same population and period.
Maternal deaths per 100,000 live births; 80% UI 174-234Relationship rule
A ratio, not a probability or count.
1 in 272 in 2023
Probability that a 15-year-old girl eventually dies from a maternal cause under current fertility and mortality conditions.
Probability expressed as 1 in NRelationship rule
Depends on more than MMR; not a rescaled ratio.
Multiple periods
Average annual pace of decline in a rate or ratio over a stated interval.
Percent per yearRelationship rule
A trend statistic; not a death rate and not a causal explanation.
The mortality records are active in Suffering Measures Registry v1.2.0. The registry preserves measure definitions, source releases, observations, relationships, chart-series mappings, uncertainty conventions, and non-additivity rules.
Downloads
Use the brief at the level you need
Visual Brief
Eight-page publication brief with six charts and interpretation controls.
Open PDFMedia summary
Two-page summary with key facts, definitions, and cautions.
Open PDFSource and methods note
Sources, uncertainty, geography rules, discrepancy decisions, and release status.
Open PDFChart pack
Wide/mobile PNG and SVG files, chart-data CSVs, and accessibility text.
Download ZIPAccessible data tables
HTML tables for all six charts, including separate child and maternal regional data.
Open tablesSuffering Measures Registry
Published source, measure, observation, relationship, chart, entity, and content records.
Open JSONSources and release boundary
Official estimates remain in their own systems
Child mortality
United Nations Inter-agency Group for Child Mortality Estimation, Levels & Trends in Child Mortality - Report 2025. Current-vintage trend window 1990-2024; 90% uncertainty intervals.
Maternal mortality
WHO, UNICEF, UNFPA, World Bank Group and UN DESA Population Division, Trends in maternal mortality estimates 2000 to 2023 (revised 2025 vintage); 80% uncertainty intervals.
The exact source binaries are retained in the private reproducibility archive and are not redistributed through the public site. Published charts use the source-native values documented in the v1.1 data package. See the source and methods note for hashes, schema findings, uncertainty, geography, and discrepancy decisions.