Published pilotRetrospective annualized scenarioP2 - evidence-informed mappingD1 - illustrative duration

Food insecurity experienced by people, 2023-2025

FAOSTAT FIES country evidence with an Experimental Retrospective Annualized USU Scenario

Series IDWSI-FIES-2023-2025-v1.0
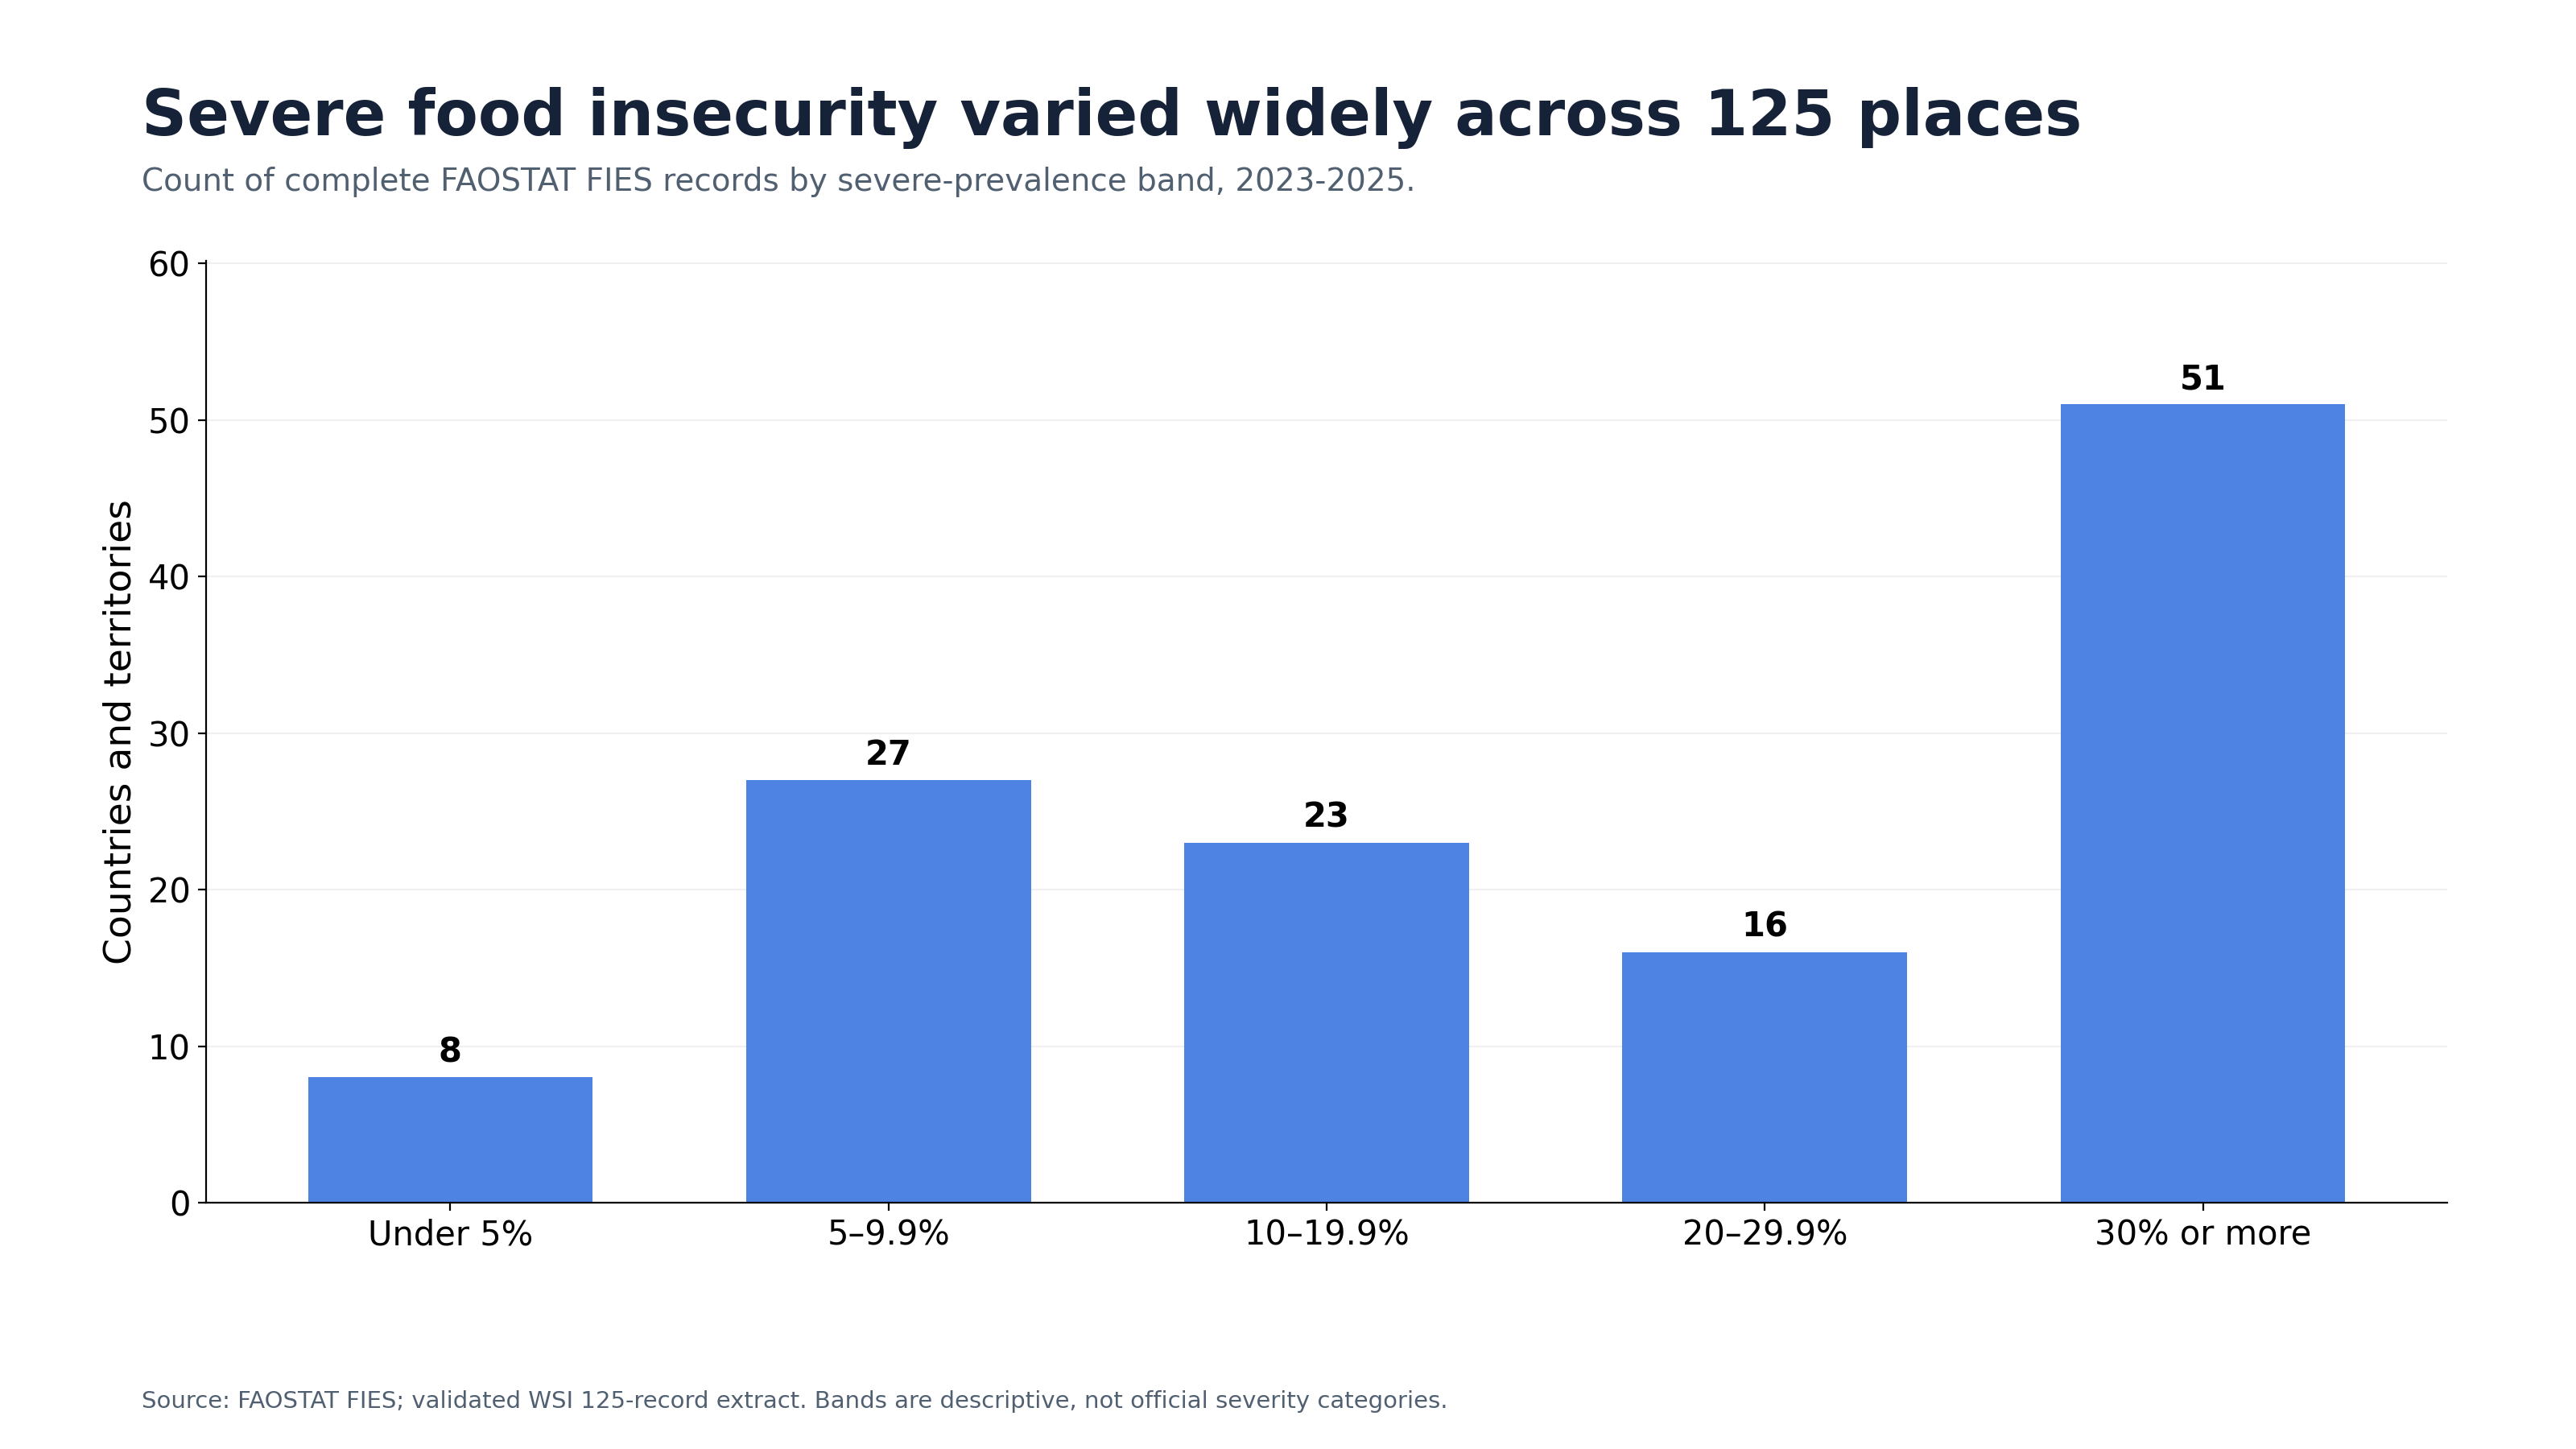
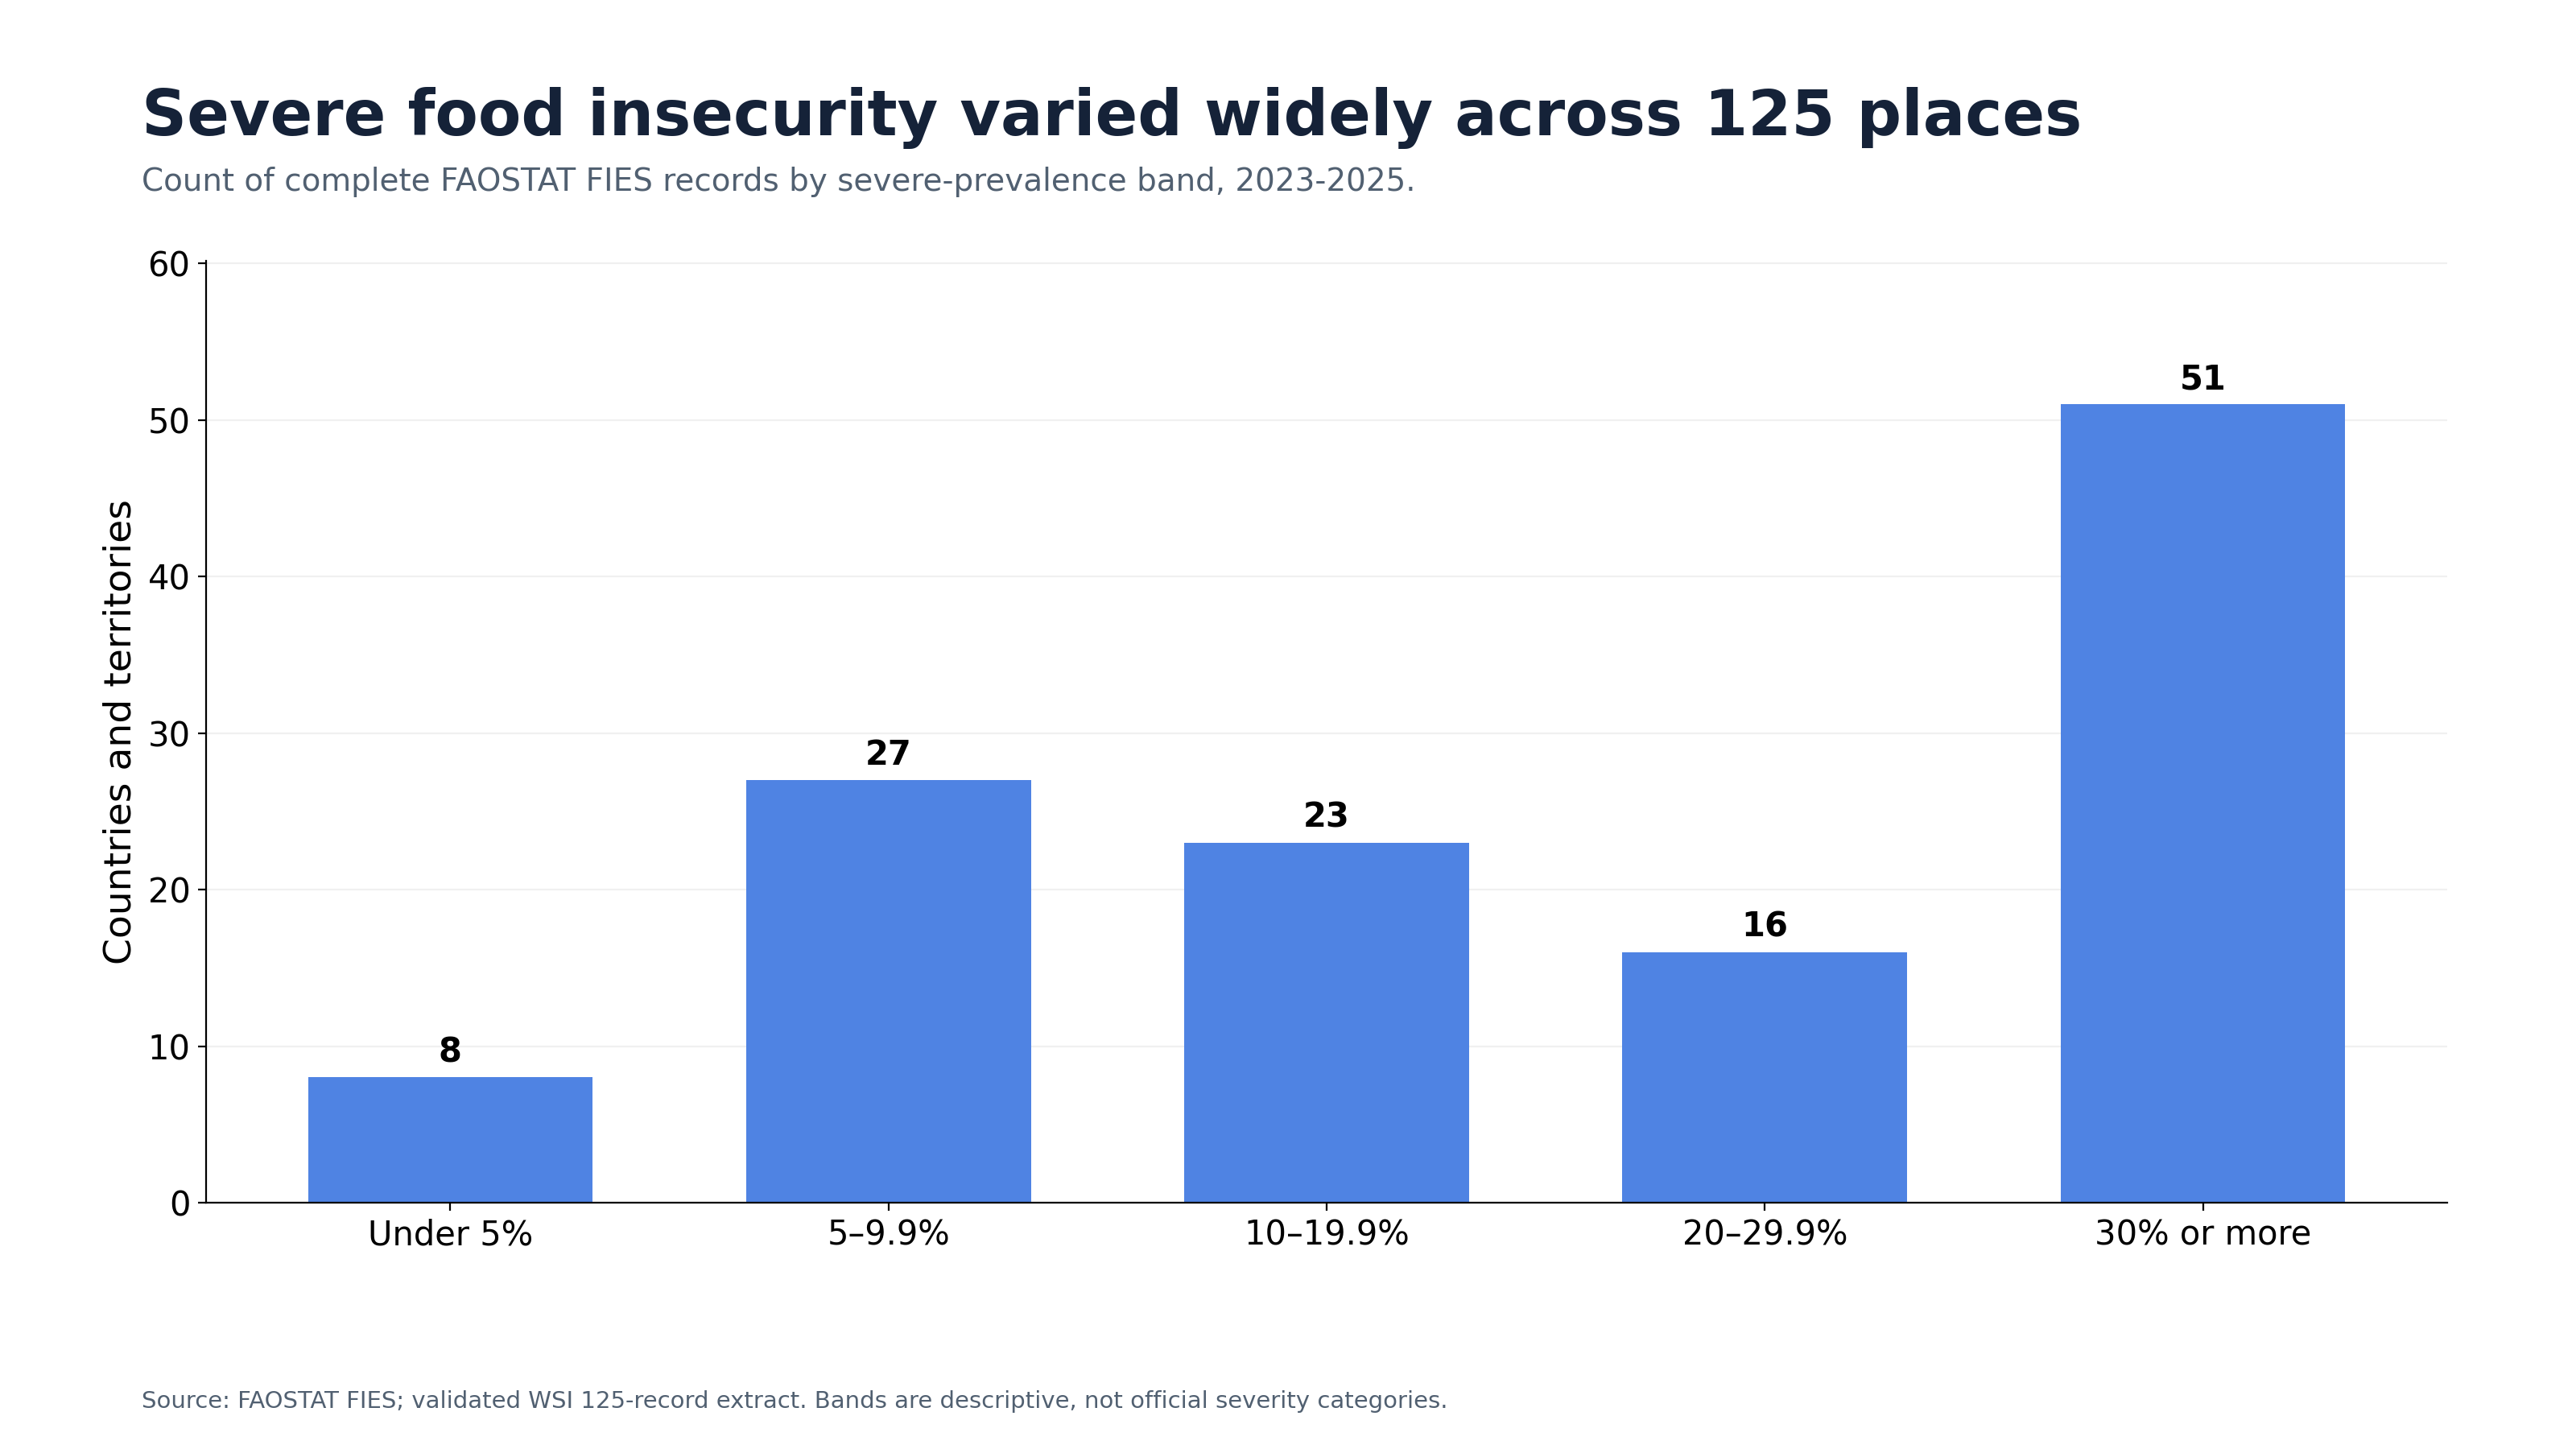
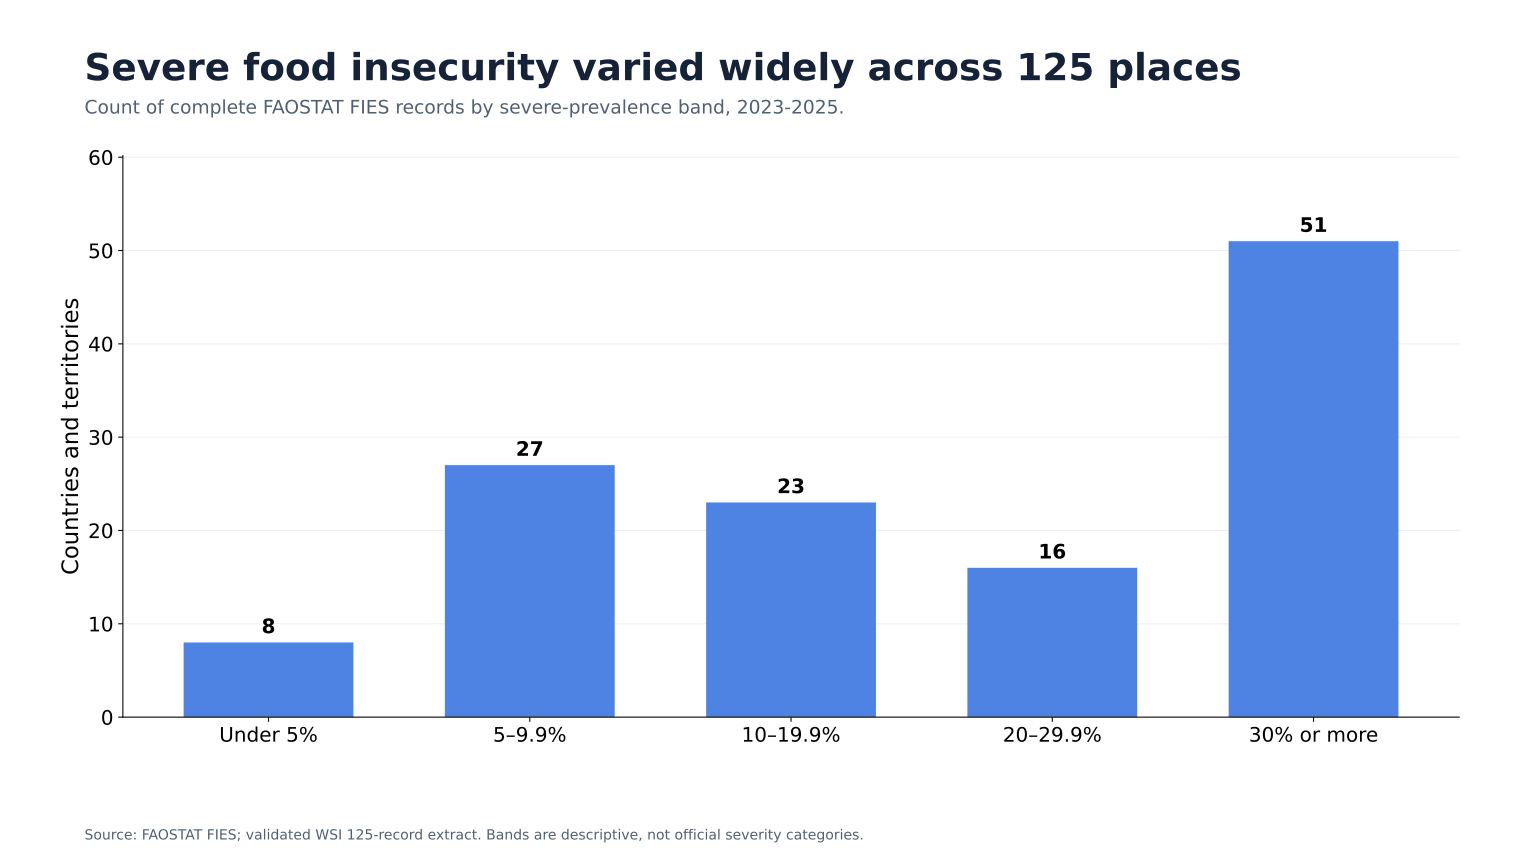
Geographic scope125 countries or territories with complete prevalence records
Time basisRepresentative average-year scenario from 2023-2025 source values
Primary sourceFAOSTAT FIES / SDG Indicator 2.1.2
Source evidence125 complete country or territory prevalence records

99 exact population records; 26 censored records reported per 100,000 only

Experimental WSI estimate2.66 million annualized USU per 100,000

Median deterministic range: 263,721-5,732,063 USU per 100,000

Main insightDuration assumptions dominate the modeled scale.

Median duration-only high/low spread: 11.67x; intensity-only spread: 1.84x.

Time basisRepresentative average-year annualized scenario

The 2023-2025 source period is not multiplied by three.

This series tests whether a directly experiential, internationally calibrated food-insecurity source can support a transparent annualized USU scenario.

FAO reports moderate-or-severe and severe FIES prevalence. WSI derives a mutually exclusive moderate-only state, then applies approved intensity and days-at-severity scenarios while keeping the source evidence and model assumptions separate.

Central scenario median across 125 records2.66 million annualized USU per 100,000Representative average-year scenario
Deterministic scenario range263,721-5,732,063 annualized USU per 100,000Approved low and high intensity-duration scenarios; not a confidence interval.
Experimental retrospective annualized scenario. FAO reports retrospective food-insecurity prevalence. WSI adds provisional P2 intensity mappings and D1 days-at-severity scenarios. The duration values were not measured by FAO and are the main driver of the modeled scale.
  • Separates moderate-only and severe food insecurity within one annualized scenario framework.
  • Reports per-100,000 profiles for all 125 complete prevalence records without forcing censored population totals.
  • Uses a wide duration stress test to show how strongly unobserved duration affects the result.
  • Preserves the direct experiential meaning of the FIES source while labeling every added assumption.
  • The result is a modeled representative-year scenario, not a measured annual burden and not a three-year cumulative total.
  • The low-high span is deterministic, not a statistical confidence interval.
  • No country ranking or global total is published.
  • Exact total scenarios are limited to 99 exact source-population records; 26 censored records remain per 100,000 only.
  • Mortality, malnutrition, medical complications, long-term consequences, and broader poverty-related harms remain outside the pilot USU.
  • A moderate-only confidence interval is not derived from the nested FAO intervals.
Model assumptions at a glance

Moderate-only intensity: 2/3/4 with 10/70/115 days. Severe intensity: 4/5/6 with 7/50/85 days.

Wide duration stress at central intensity: moderate-only 1/90/240 days; severe 1/60/180 days.

Linear p=1; no overlap adjustment; R1=1.96875 intensity-days; mortality separate.

Model maturity: P2 - evidence-informed intensity; D1 - illustrative duration.

Reports and methods

2-minute public brief

A two-page summary of the source evidence, annualized scenarios, main insight, and interpretation limits.

Public Brief

Full research report

The full report explains the FAOSTAT source, approved mappings, annualized calculations, sensitivity, and safeguards.

Full Report

For technical readers: research methods and assumptions (PDF). Data: per-100,000 results and exact-total results.