Published pilotDaily-equivalent burden rateP1 - illustrative

Acute Food Insecurity Across 14 Cadre Harmonisé Countries, June-August 2026

Harmonized severity evidence with an Experimental Daily-Equivalent USU Pilot Estimate

Series IDWSI-AFI-CH-2026-01
Geographic scopeAnalyzed populations in 14 CH countries
Time basisDisplayed June-August 2026 period; one-day model
Primary sourceIPC-CH Dashboard / Cadre Harmonisé

Evidence retained before modeling

434,406,497Analyzed population
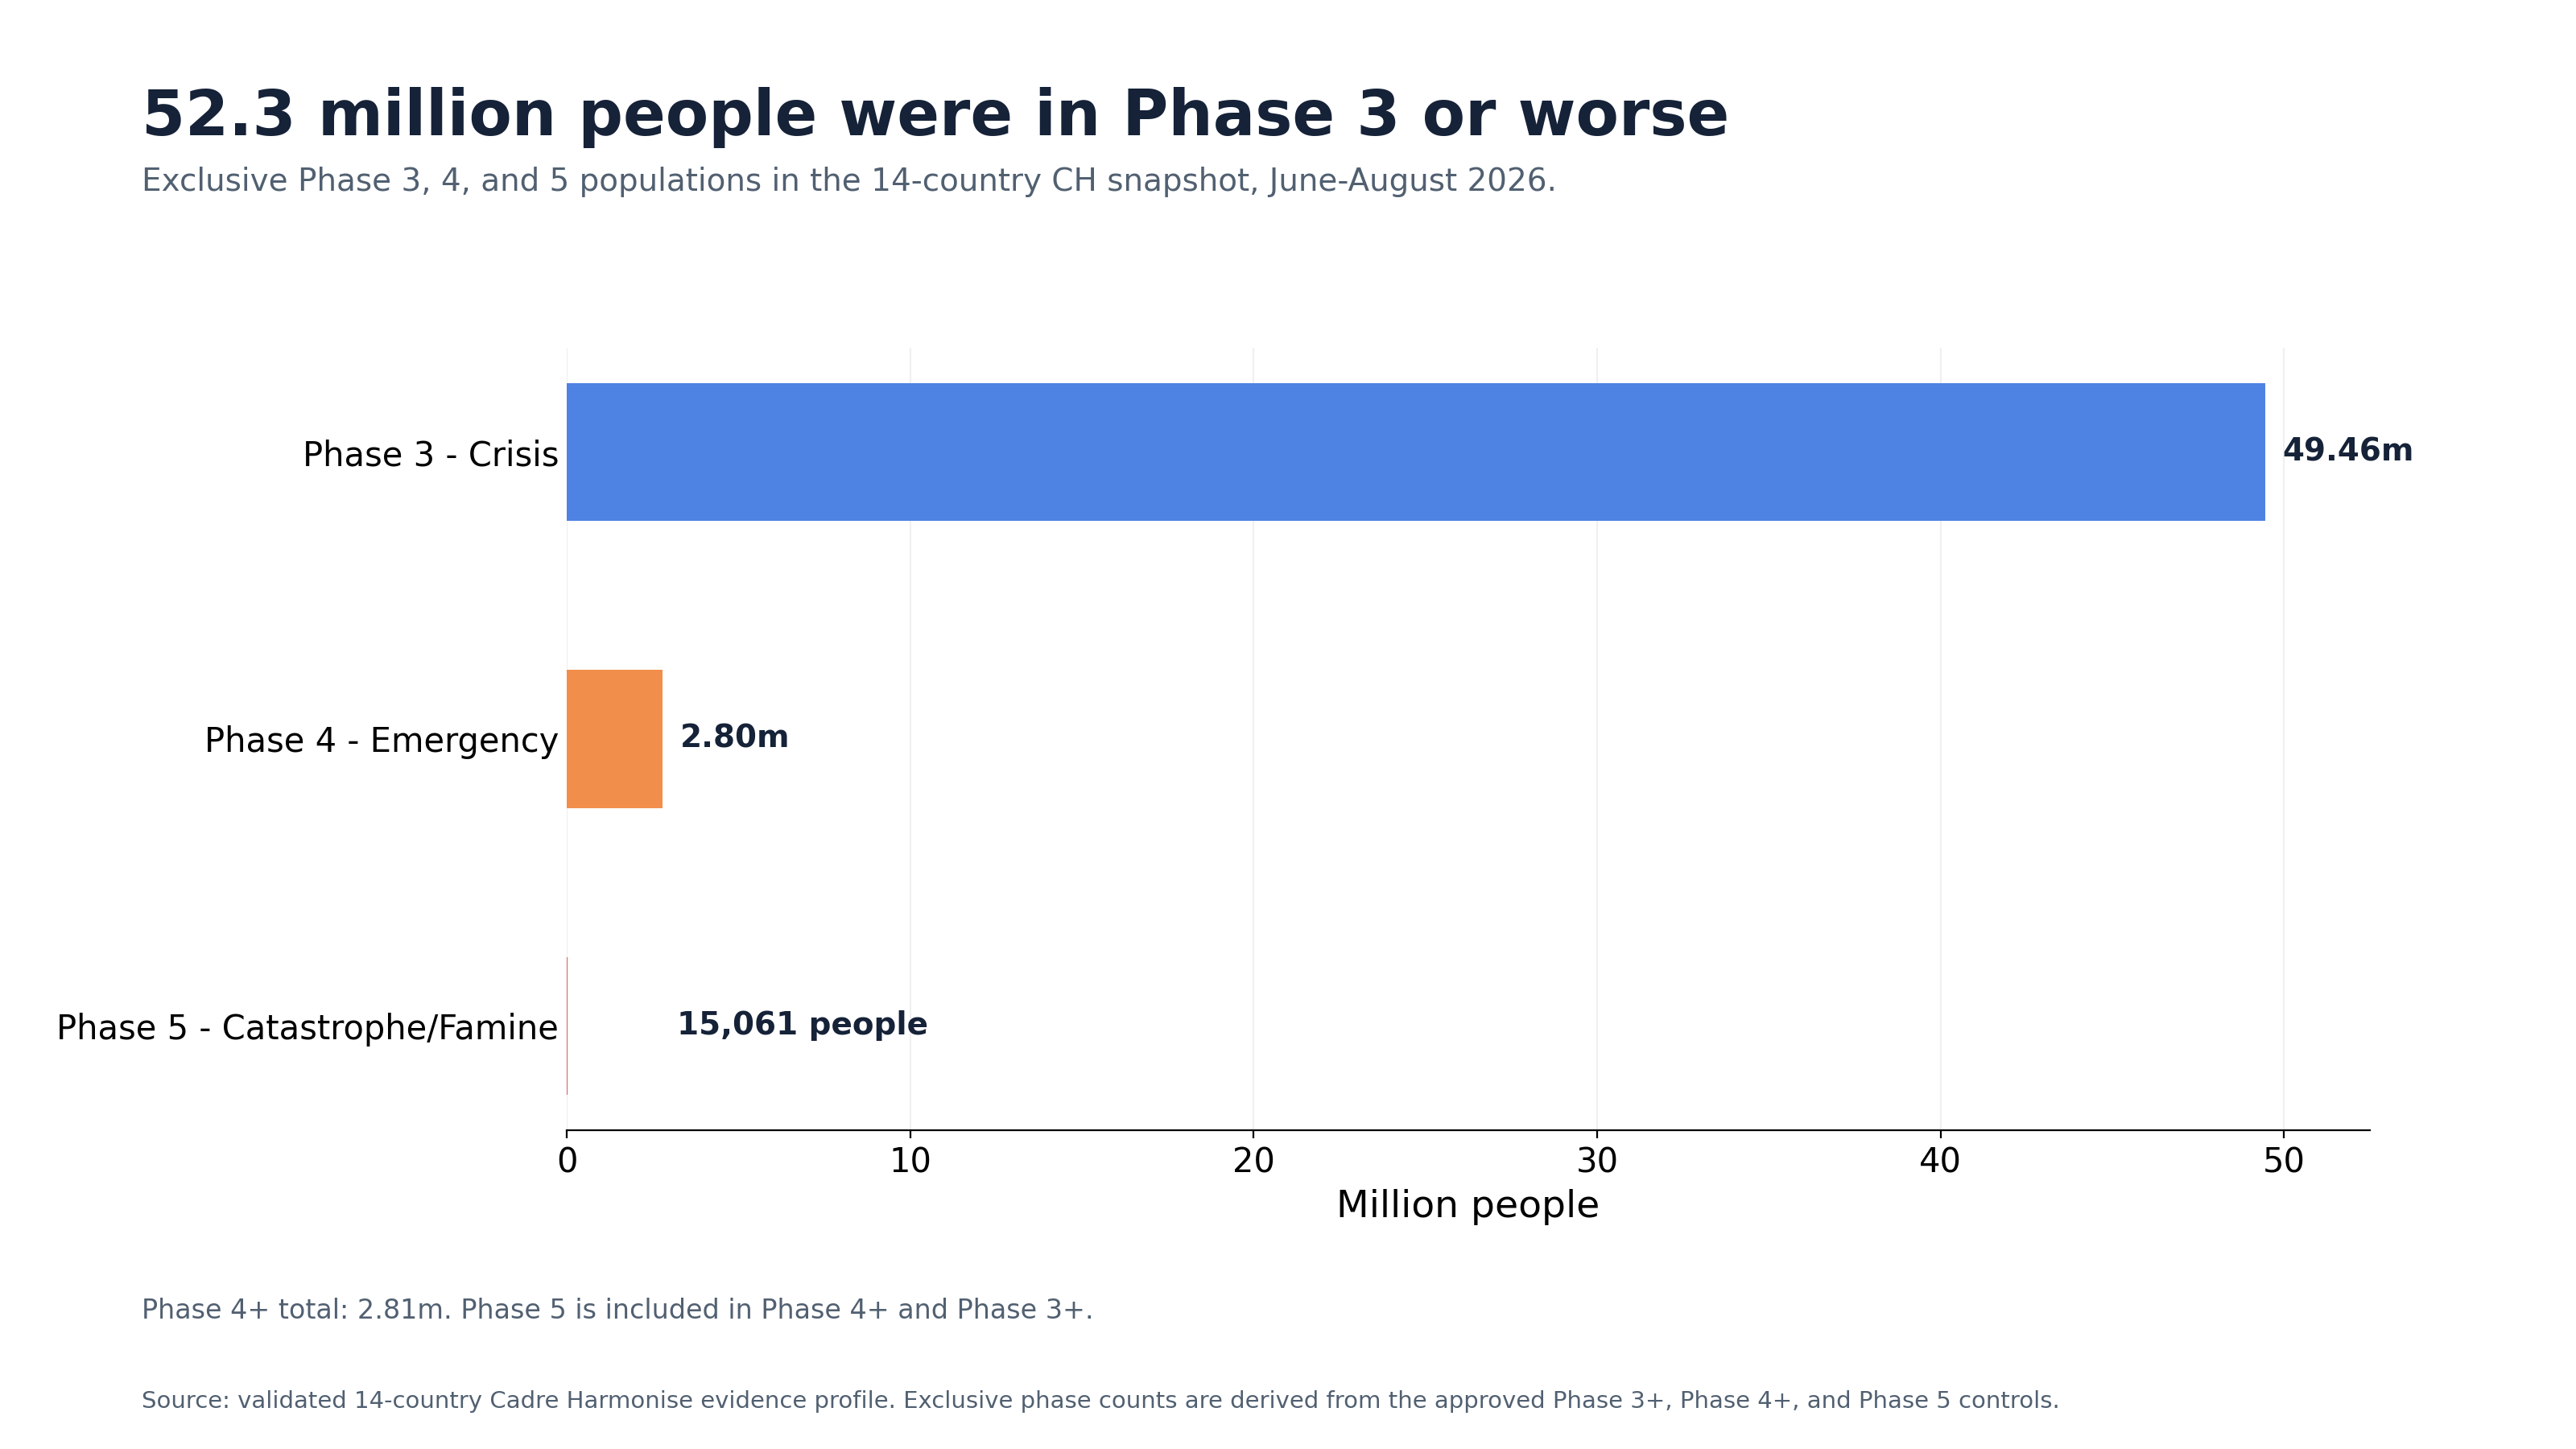
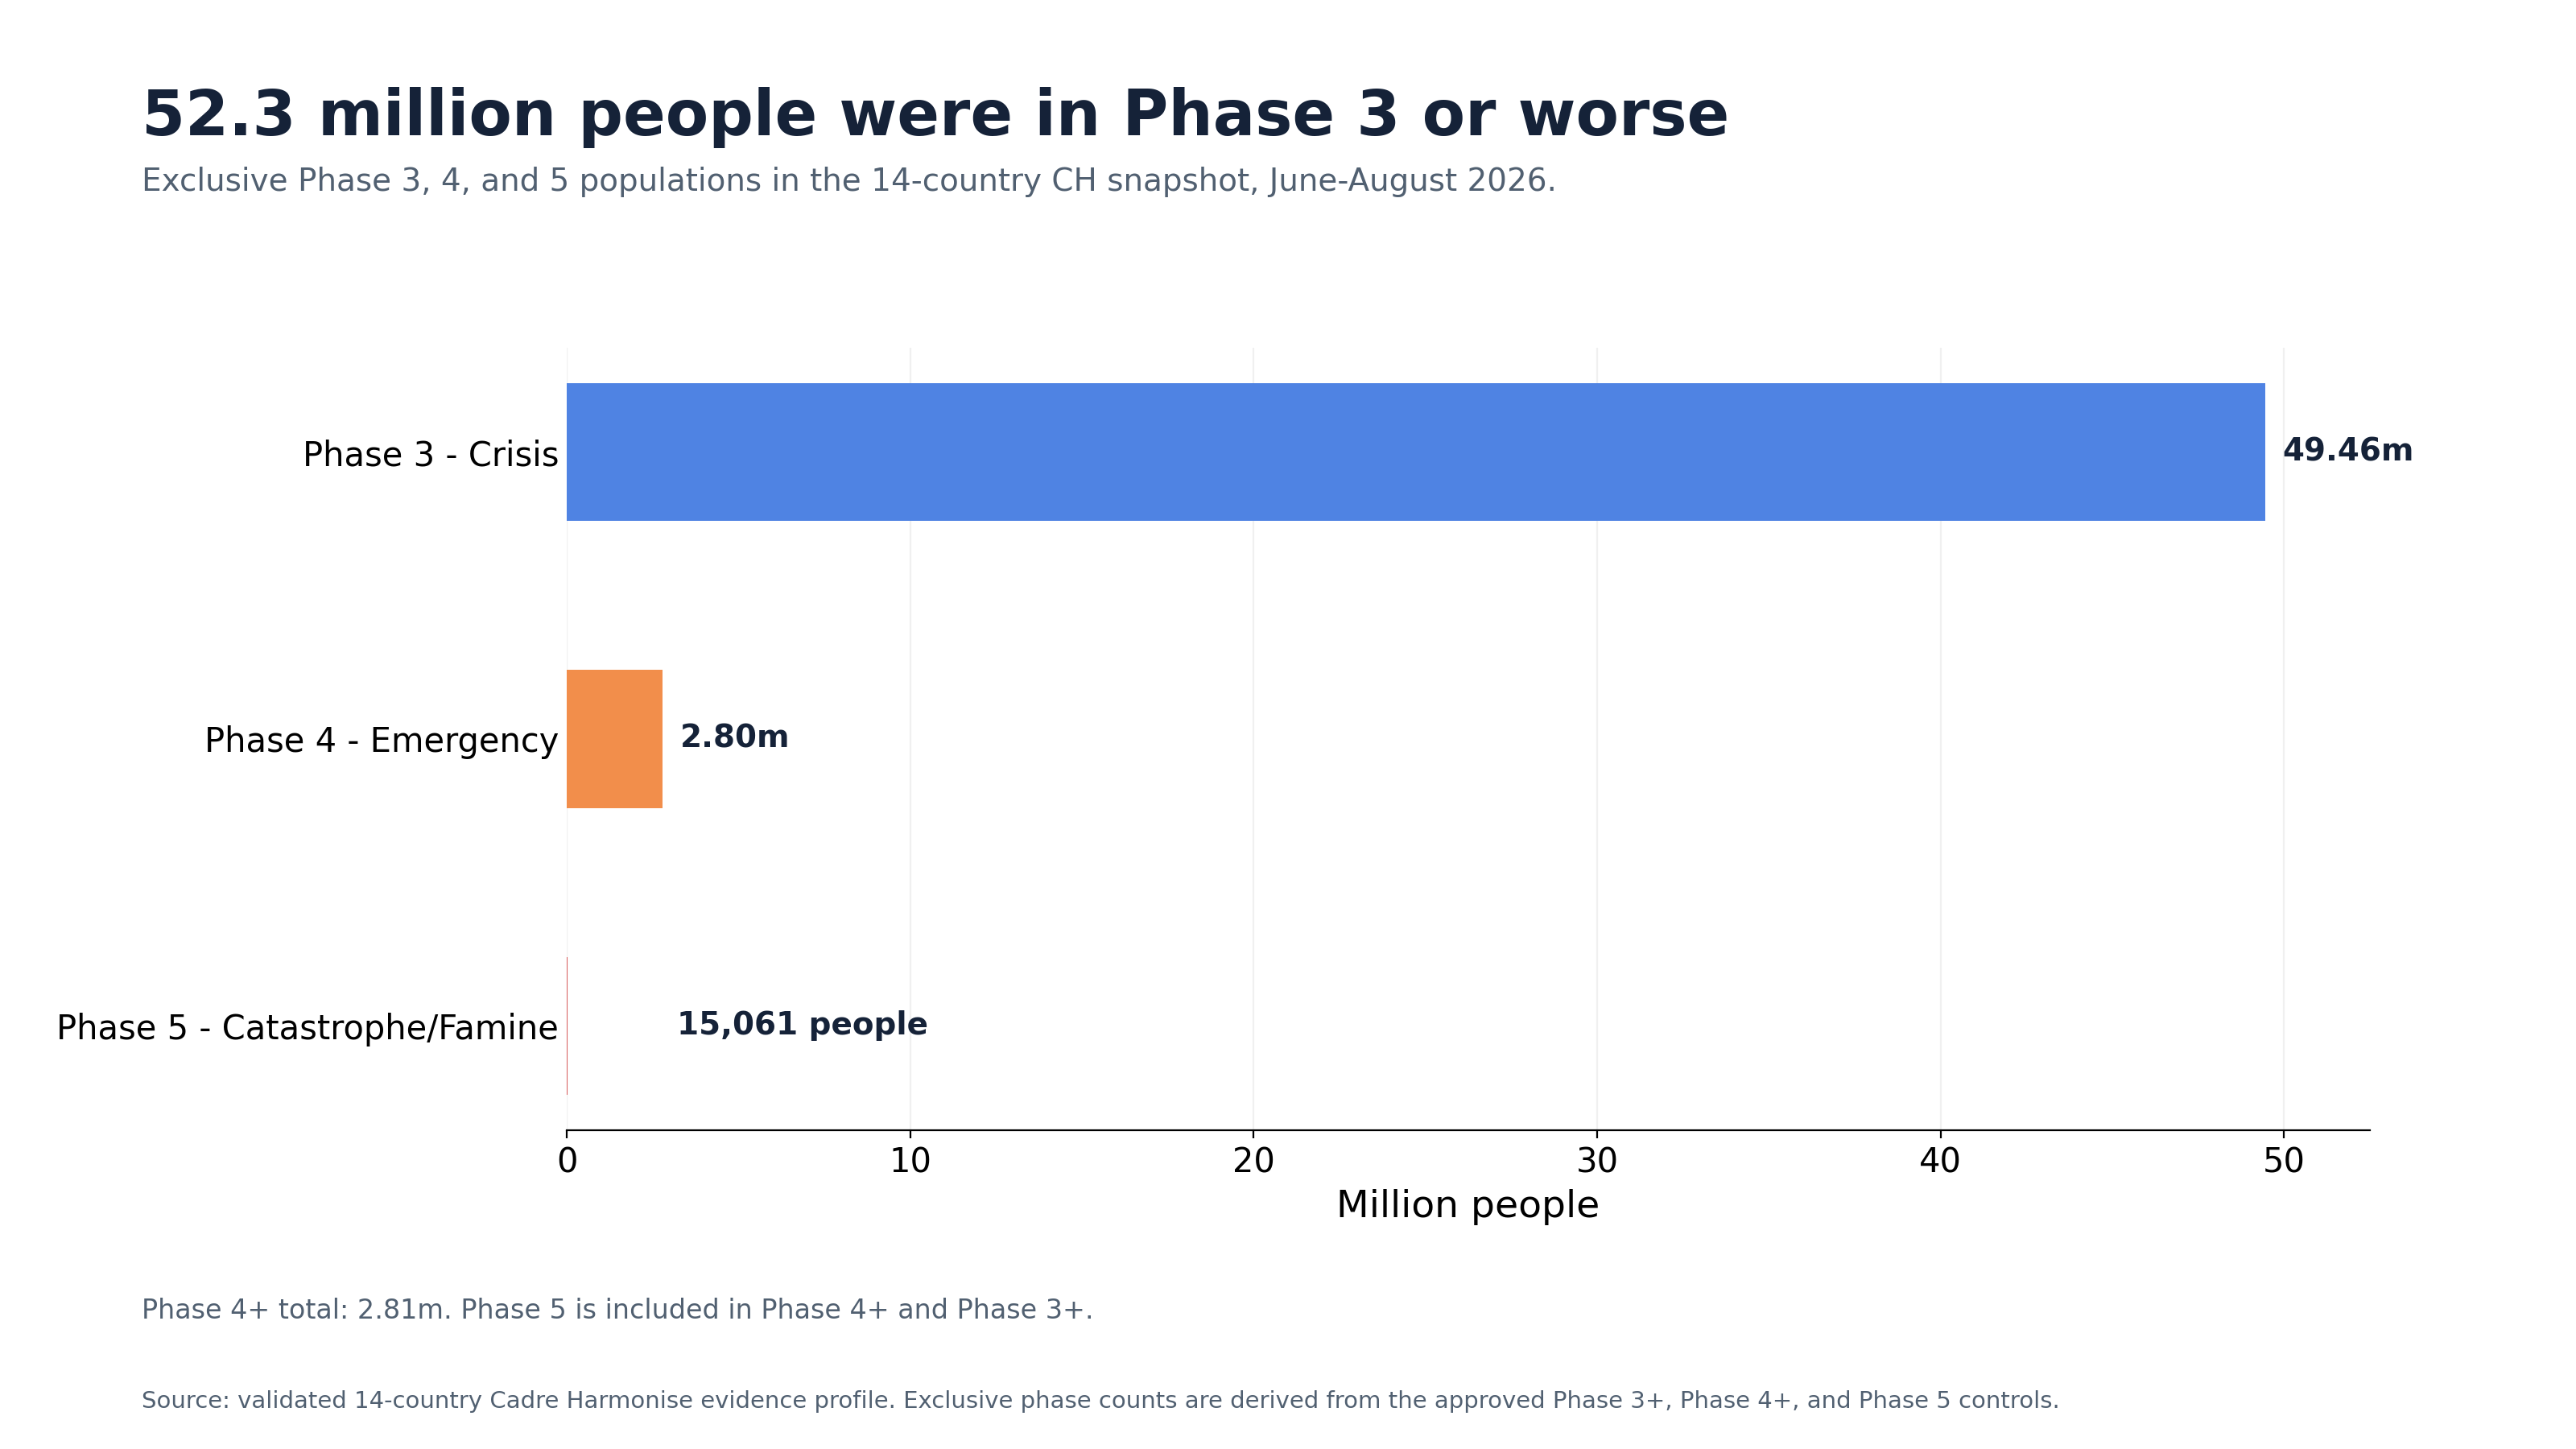
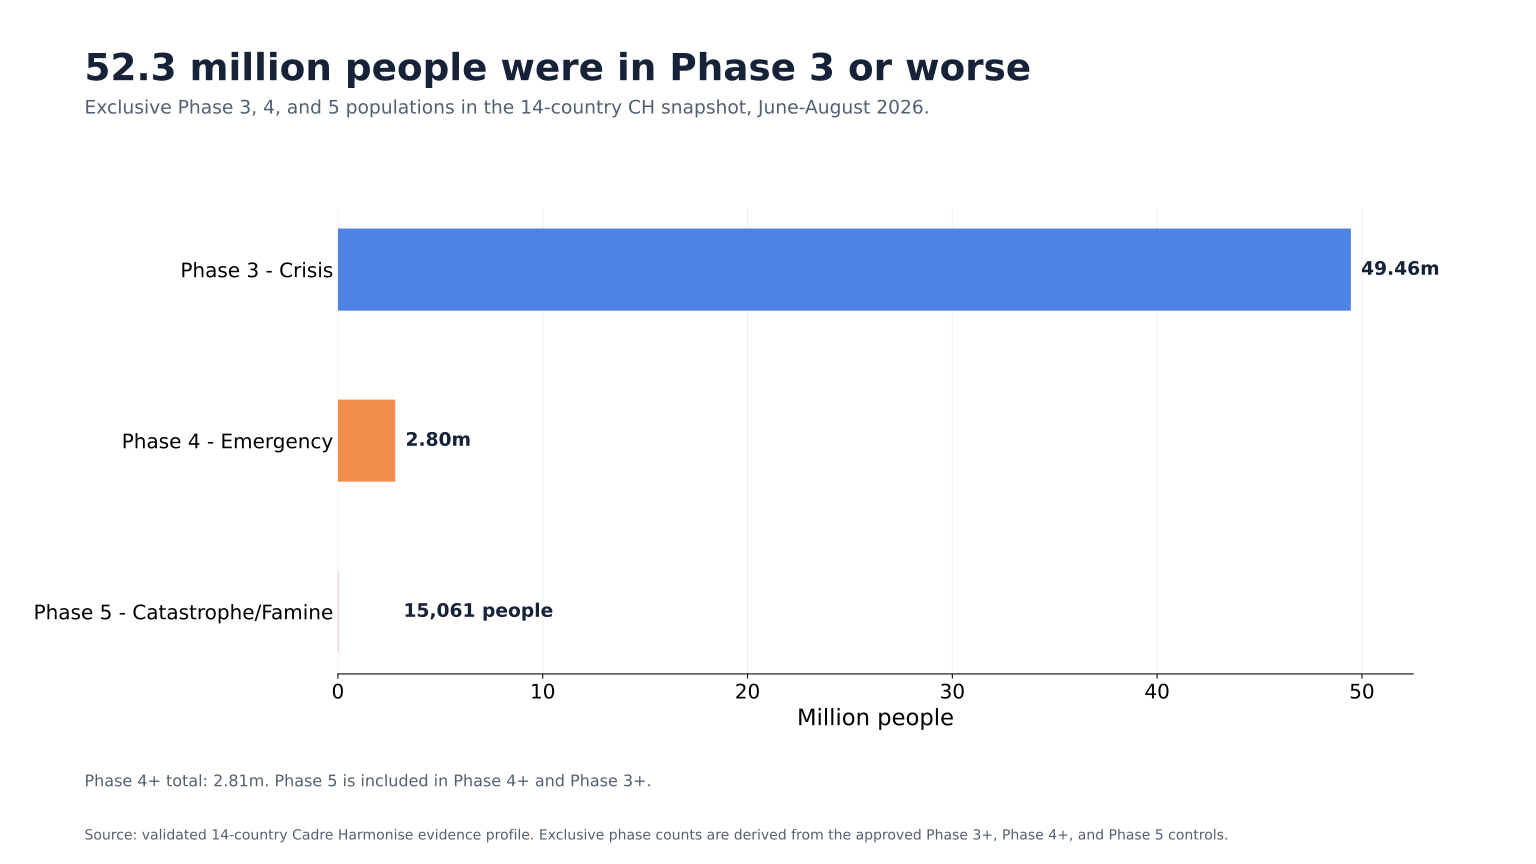
52,273,938Phase 3 or above
2,814,246Phase 4 or above
15,061Phase 5

Approved experimental pilot specification

StateLowCentralHigh
Phase 3 - CrisisIntensity 3Intensity 4Intensity 5
Phase 4 - EmergencyIntensity 5Intensity 6Intensity 7
Phase 5 - CatastropheIntensity 7Intensity 8Intensity 9

The pilot uses p=1, no overlap adjustment, and mortality outside the USU calculation. The state mappings are versioned research assumptions, not source-provided suffering scores.

Central experimental estimate109 million USU/dayOne-day equivalent modeled burden rate
Deterministic mapping range82.5-136 million USU/dayApproved low and high scenarios; not a confidence interval.
Experimental USU pilot estimate. The source directly reports the stated population, episodes, or severity categories. WSI applies provisional intensity and, where applicable, duration mappings to estimate linear intensity-time burden and expresses that burden relative to the declared renal-colic reference. The deterministic mapping range reflects approved low, central, and high scenarios, not a confidence interval. Mortality is excluded from the pilot USU calculation and is shown separately when the source supplies a comparable mortality measure.

Mortality treatment: Mortality is excluded from USU; the 14-country subset does not provide one directly comparable death total.

Interpretation beyond the source indicators

Creates a daily-equivalent common unitThe model combines Phase 3, 4, and 5 populations under one transparent intensity framework.
Decomposes severityPhase 3 contributes 92.1%, Phase 4 contributes 7.8%, and Phase 5 contributes 0.06% of central modeled burden.
Does not change country orderingTotal USU ranks match Phase 3+ population ranks, and per-analyzed-population ranks match Phase 3+ shares.
Shows where the source already explains the resultFor this subset, the primary ordering is already visible in the official phase counts and shares.
  • The result is USU per day and is not extrapolated across June-August.
  • Country counts apply to analyzed populations; reported coverage ranges from 20% to 100%.
  • CH phases are classifications, not direct subjective suffering ratings.
  • P1 mappings are illustrative and have not been externally validated.

Download the complete public record

The public report provides the accessible narrative. The technical note and mapping notes document the calculation and assumptions.

Read reportTechnical methodsPhase 3 mappingPhase 4 mappingPhase 5 mapping