Published pilotDaily-equivalent burden rateP1 - illustrative

Child Wasting and Severe Wasting, 2024

Global and regional evidence with an Experimental Daily-Equivalent USU Pilot Estimate

Series IDWSI-CW-JME-2024-01
Geographic scopeGlobal and four printed regional groups
Time basis2024 prevalence estimates; one-day model
Primary sourceUNICEF/WHO/World Bank JME

Evidence retained before modeling

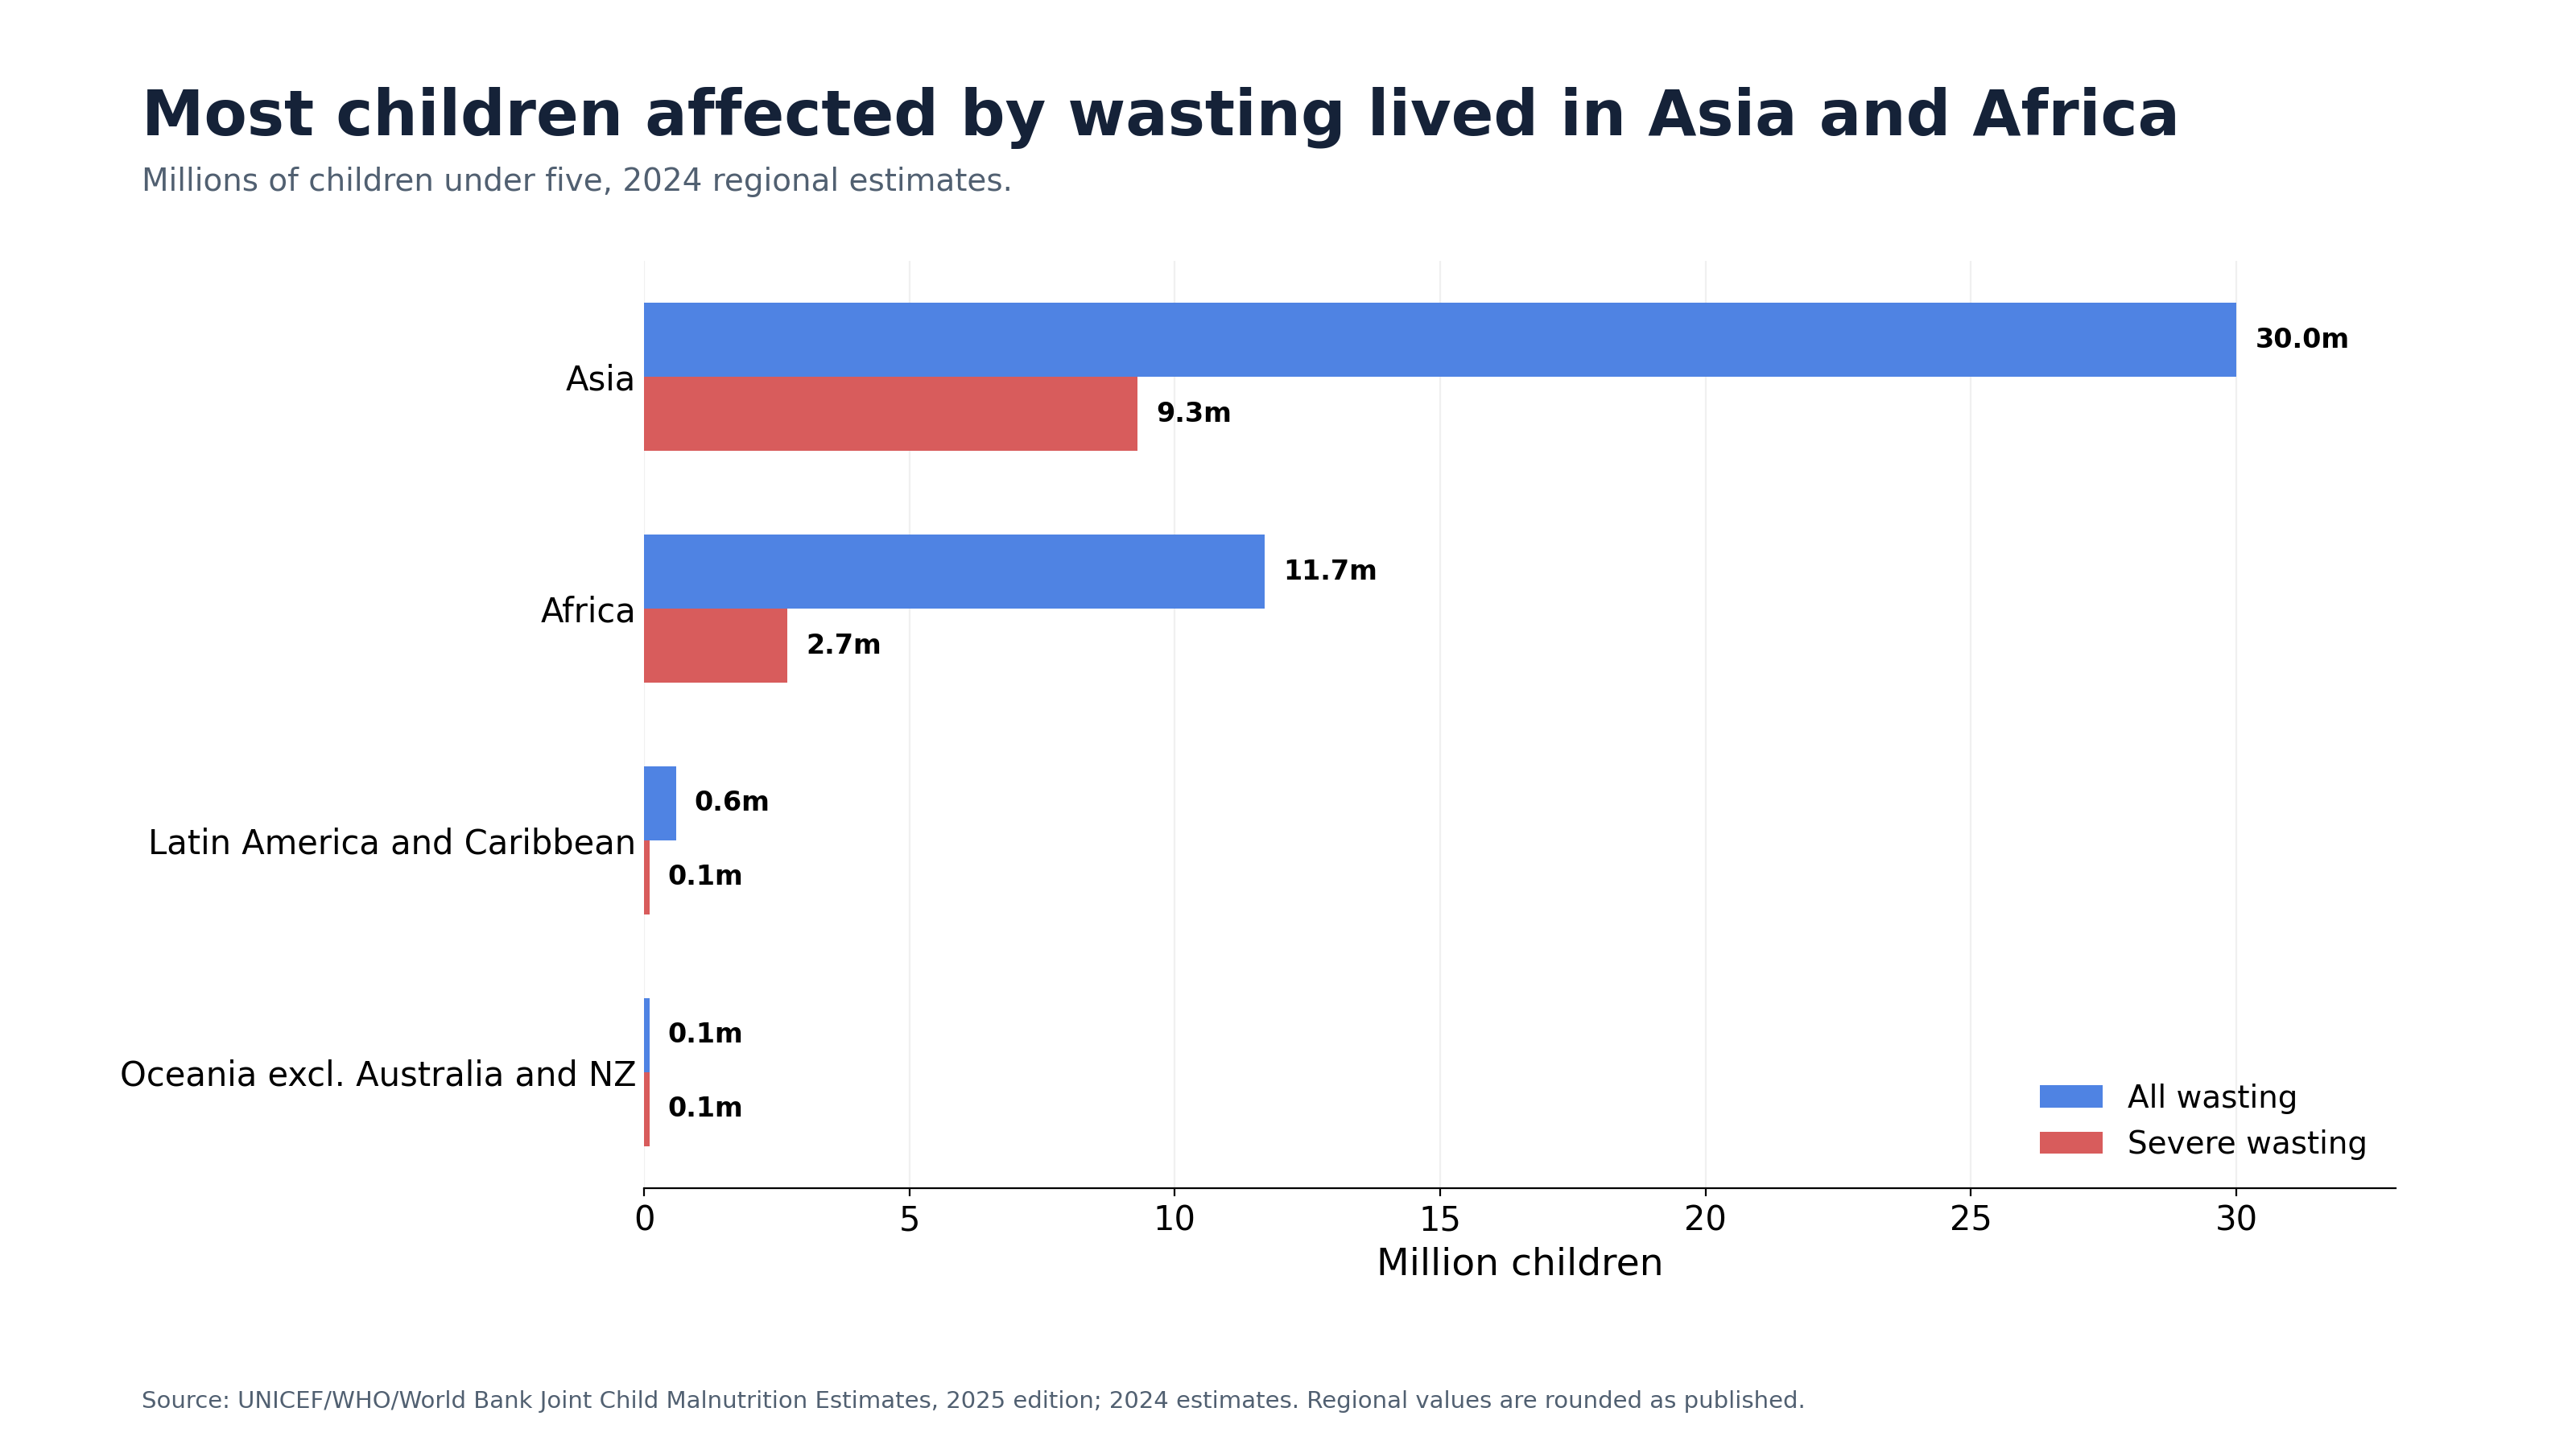
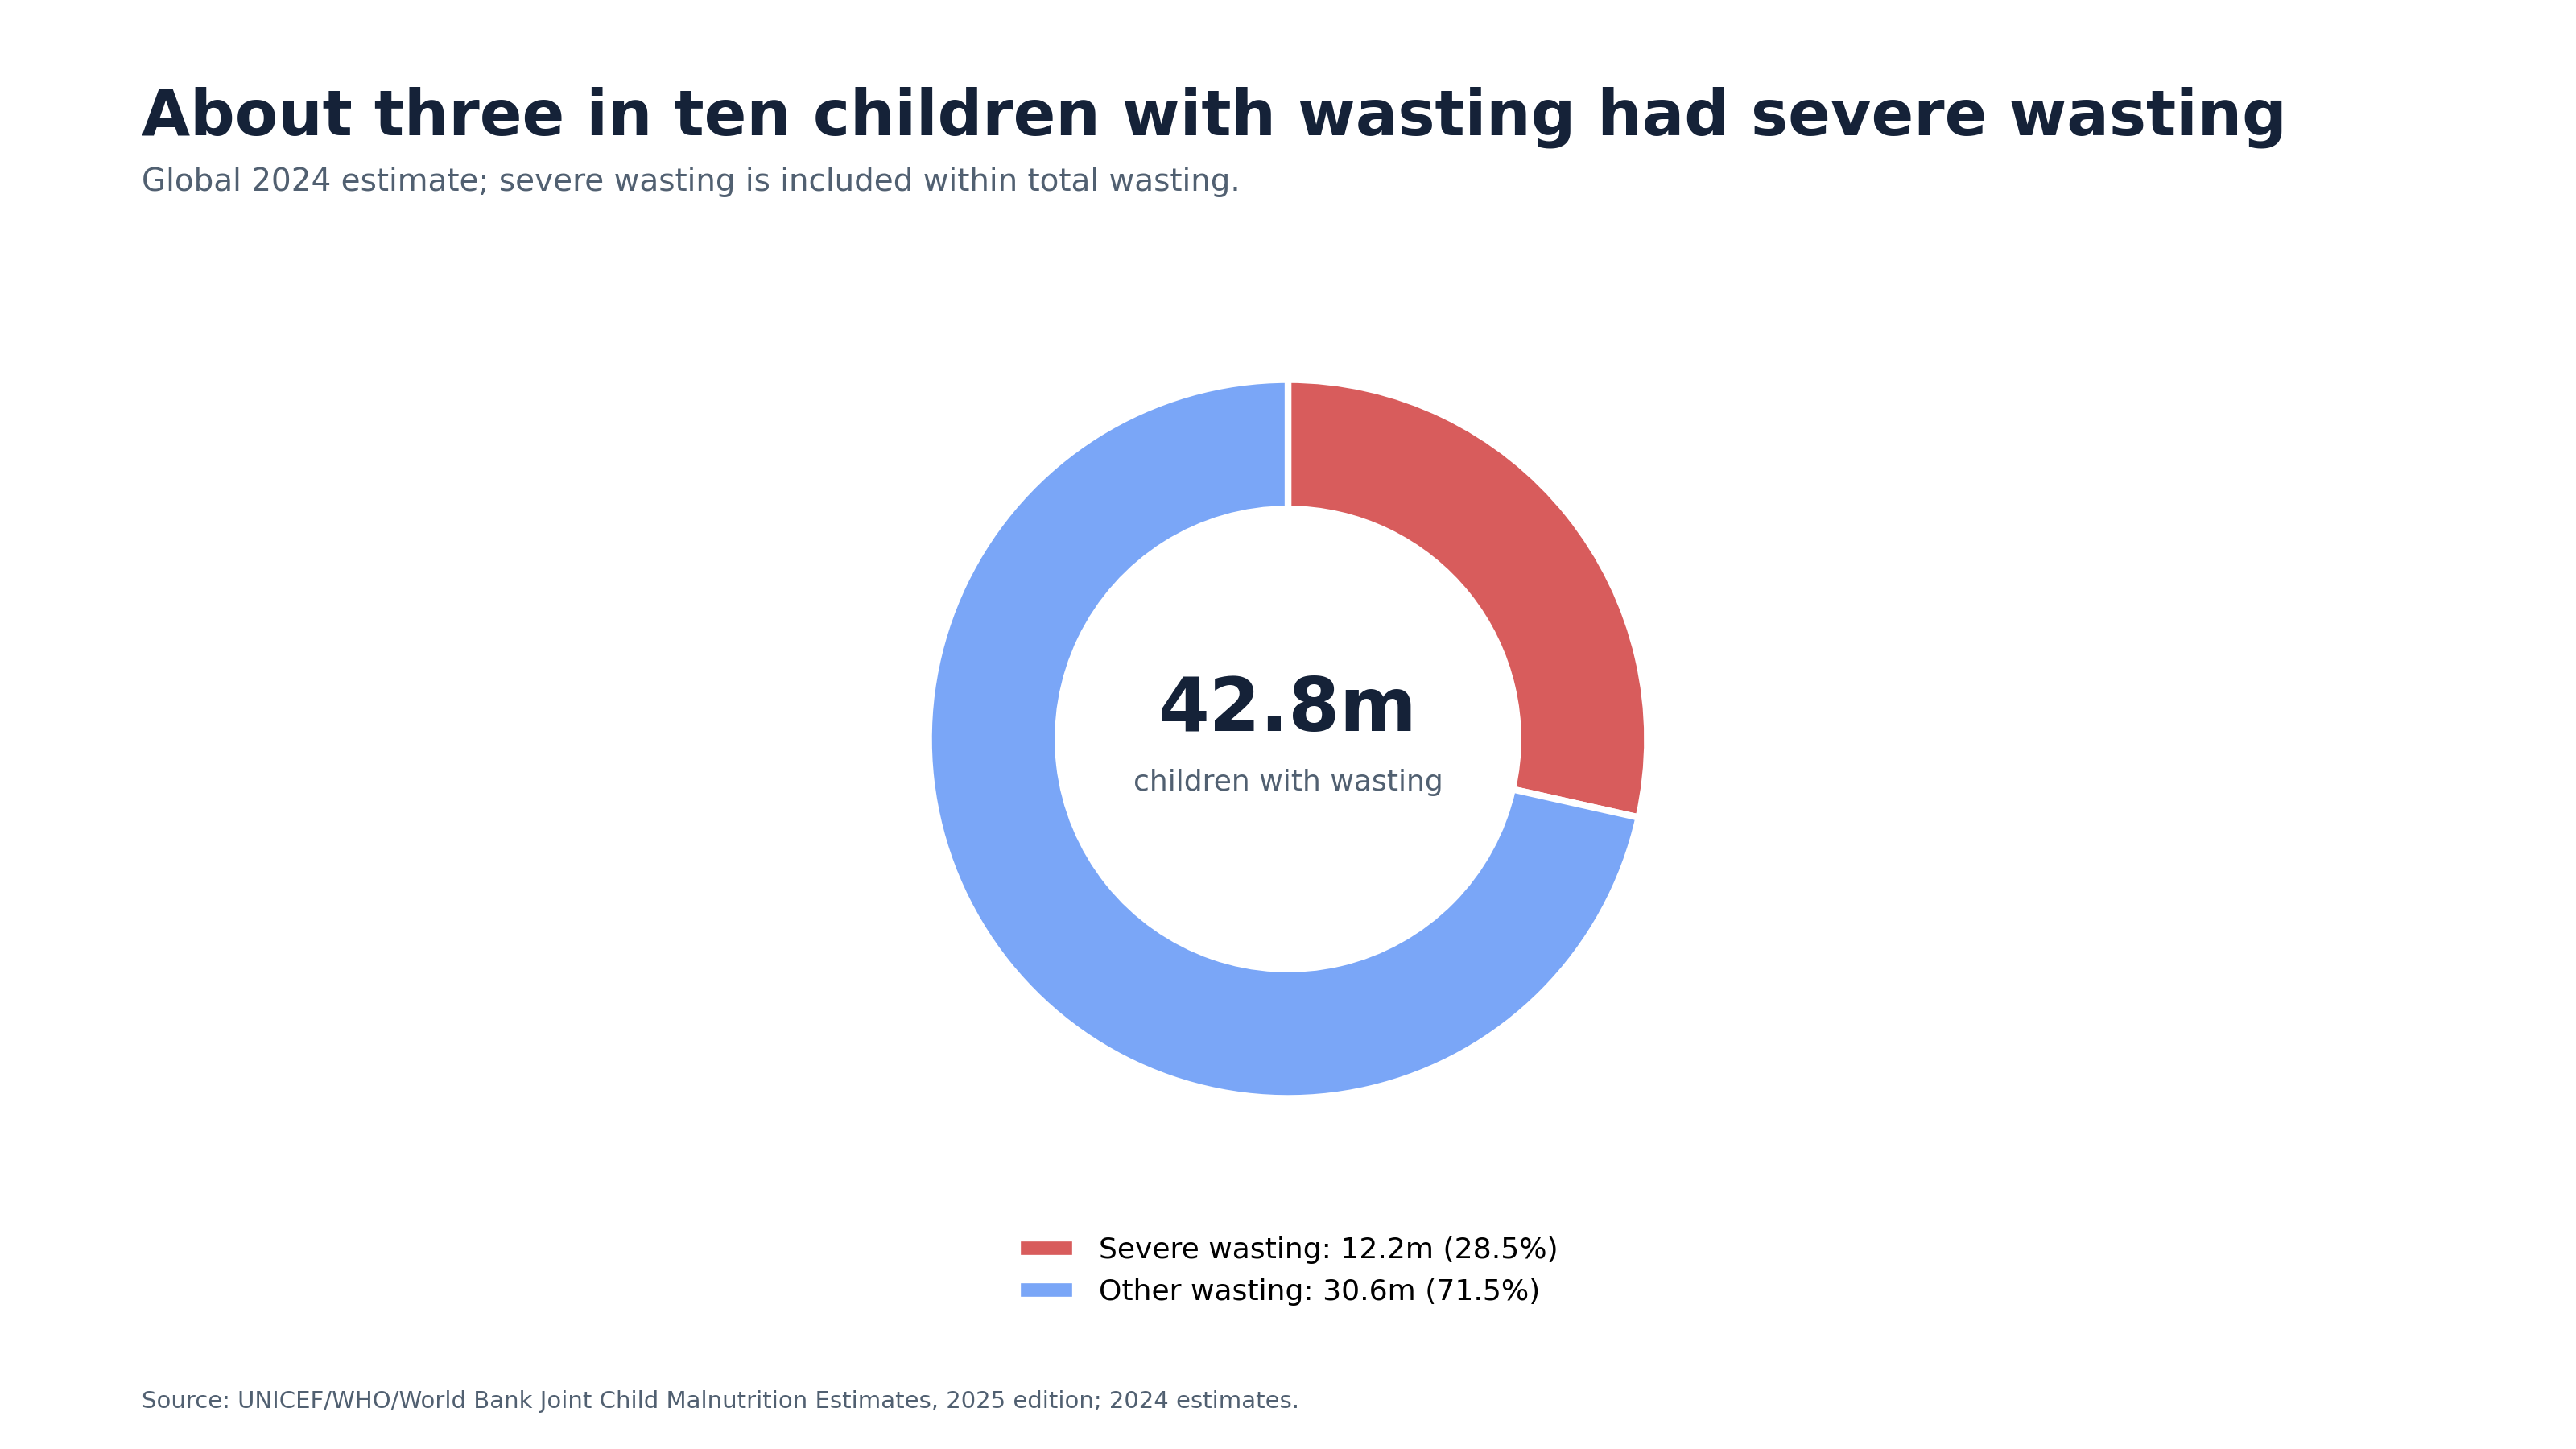
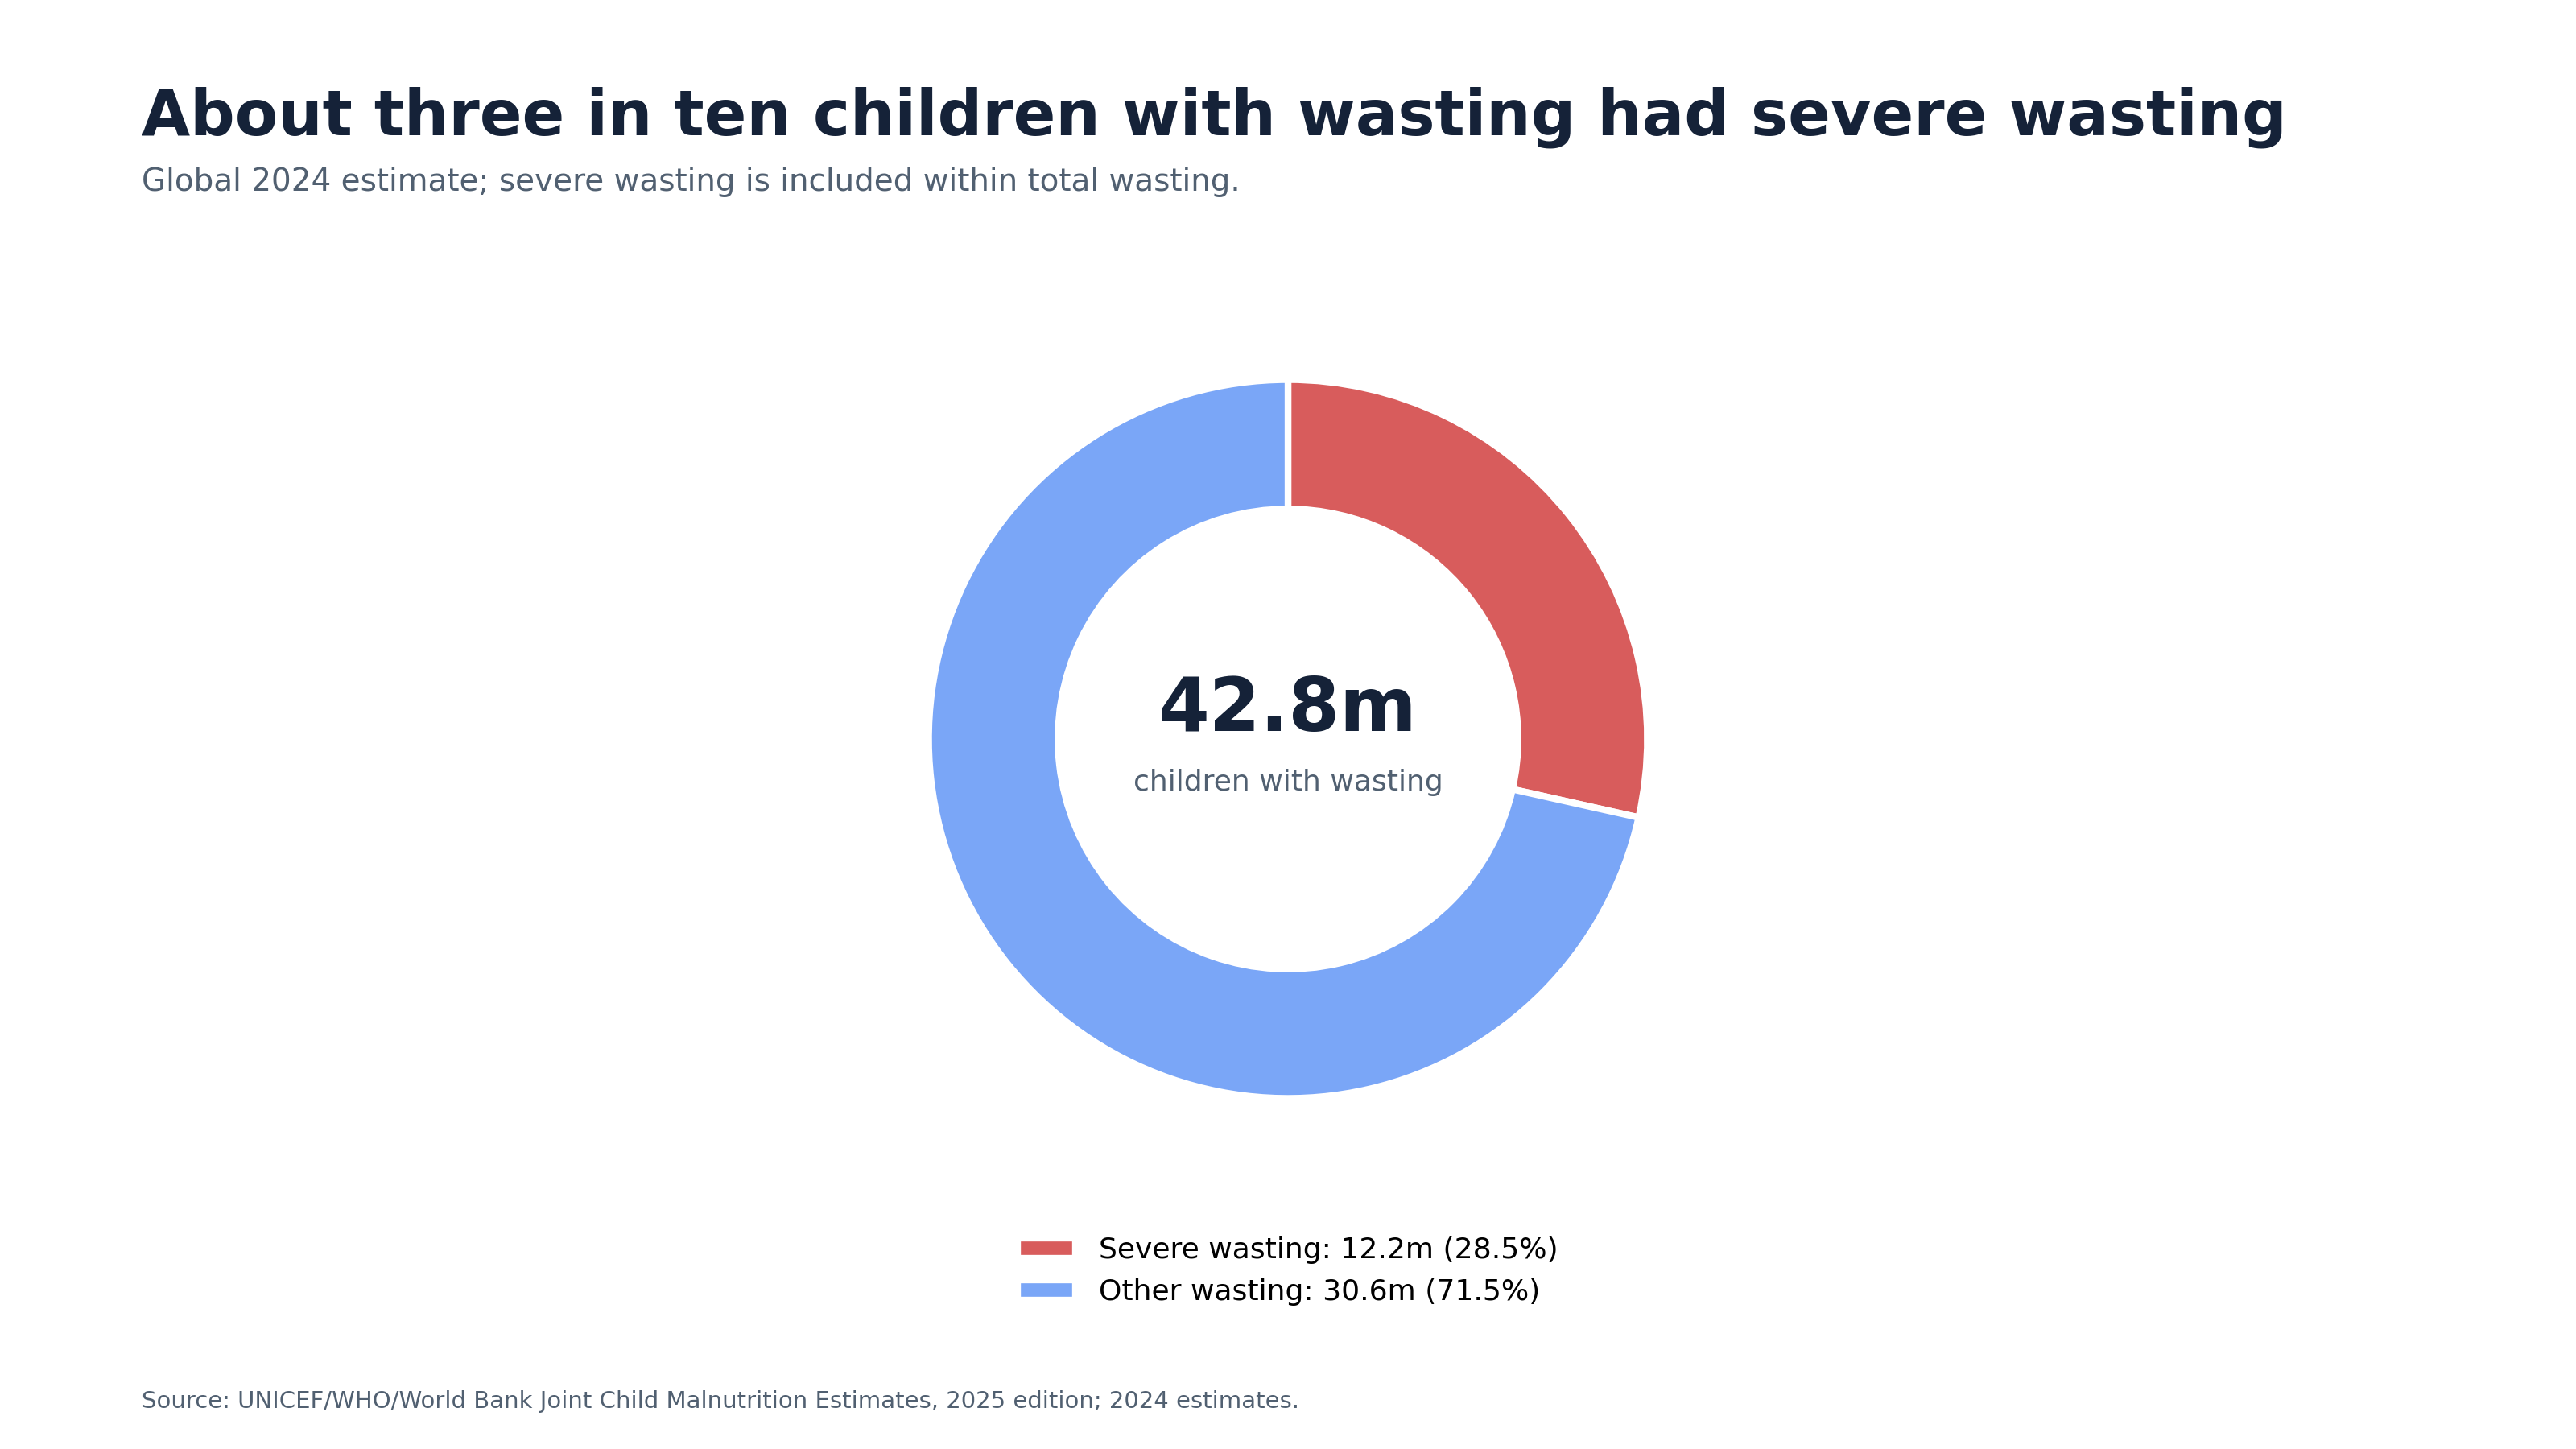
42.8 millionChildren with wasting
12.2 millionChildren with severe wasting
30.6 millionDerived moderate wasting
2024Reference year

Approved experimental pilot specification

StateLowCentralHigh
Moderate wastingIntensity 1Intensity 2Intensity 3
Severe wastingIntensity 2Intensity 4Intensity 6

The pilot uses p=1, no overlap adjustment, and mortality outside the USU calculation. The state mappings are versioned research assumptions, not source-provided suffering scores.

Central experimental estimate55.9 million USU/day globallyOne-day equivalent global modeled burden rate
Deterministic mapping range27.9-83.8 million USU/day globallyApproved low and high scenarios; not a confidence interval.
Experimental USU pilot estimate. The source directly reports the stated population, episodes, or severity categories. WSI applies provisional intensity and, where applicable, duration mappings to estimate linear intensity-time burden and expresses that burden relative to the declared renal-colic reference. The deterministic mapping range reflects approved low, central, and high scenarios, not a confidence interval. Mortality is excluded from the pilot USU calculation and is shown separately when the source supplies a comparable mortality measure.

Mortality treatment: Mortality is excluded from USU; the JME prevalence tables do not provide one directly comparable death total.

Interpretation beyond the source indicators

Expresses prevalence in a daily burden unitThe pilot interprets the 2024 prevalence estimates as one-day equivalent population states.
Separates moderate and severe contributionsSevere wasting contributes 44.4% of central global modeled burden despite representing 12.2 million of 42.8 million wasted children.
Does not change regional orderingAsia, Africa, Latin America and the Caribbean, and Oceania remain in the same order under all mapping scenarios.
Makes the evidence limitation visibleThe regional inputs are printed rounded estimates, so small-region derived values require caution.
  • The source is anthropometric prevalence, not a subjective experience measure.
  • Moderate wasting is derived from aligned rounded central counts only; no moderate confidence interval is created by subtraction.
  • The result is a one-day equivalent rate, not a full-year burden.
  • Mortality, infections, developmental effects, caregiver burden, and health-system burden are excluded.

Download the complete public record

The public report provides the accessible narrative. The technical note and mapping notes document the calculation and assumptions.

Read reportTechnical methodsModerate mappingSevere mapping